hp StorageWorks edge switch 2/16 service manual Part Number: A7284-96002/AA-RS2JA-TE First Edition (August 2002) This manual describes the hp StorageWorks edge switch 2/16 and attached hp StorageWorks ha-fabric manager (HAFM) application. For service representatives, it describes diagnostic procedures, repair procedures, and the removal and replacement procedures for field-replaceable units (FRUs). An illustrated parts breakdown is included for all FRUs.
© Hewlett-Packard Company, 2002. All rights reserved. Hewlett-Packard Company makes no warranty of any kind with regard to this material, including, but not limited to, the implied warranties of merchantability and fitness for a particular purpose. Hewlett-Packard shall not be liable for errors contained herein or for incidental or consequential damages in connection with the furnishing, performance, or use of this material. This document contains proprietary information, which is protected by copyright.
Contents About this Guide Intended Audience . . . . . . . . . . . . . . . . . . . . . . . . . . . . . . . . . . . . . . . . . . . . . . . . . . . . . . xiii Related Documentation . . . . . . . . . . . . . . . . . . . . . . . . . . . . . . . . . . . . . . . . . . . . . . . . . . xiii Document Conventions . . . . . . . . . . . . . . . . . . . . . . . . . . . . . . . . . . . . . . . . . . . . . . . . . . xiv Symbols in Text . . . . . . . . . . . . . . . . . . . . . . . . . . . . . . . . . . . . . . . . . . . .
Contents Power Supplies. . . . . . . . . . . . . . . . . . . . . . . . . . . . . . . . . . . . . . . . . . . . . . . . . . . . Connectors and Indicators . . . . . . . . . . . . . . . . . . . . . . . . . . . . . . . . . . . . . . . . . . . Initial Machine Load Button . . . . . . . . . . . . . . . . . . . . . . . . . . . . . . . . . . . . . . . . . Ethernet LAN Connector . . . . . . . . . . . . . . . . . . . . . . . . . . . . . . . . . . . . . . . . . . . . Power and System Error LEDs . . . . . . . . . . . .
Contents MAP 0200: POST, Reset, or IPL Failure Analysis . . . . . . . . . . . . . . . . . . . . . . . . . . . MAP 0300: Console Application Problem Determination . . . . . . . . . . . . . . . . . . . . . MAP 0400: Loss of Console Communication . . . . . . . . . . . . . . . . . . . . . . . . . . . . . . . MAP 0500: Fan and CTP Failure Analysis . . . . . . . . . . . . . . . . . . . . . . . . . . . . . . . . . MAP 0600: Port Failure and Link Incident Analysis. . . . . . . . . . . . . . . . . . . . . . . . . .
Contents External Loopback Test. . . . . . . . . . . . . . . . . . . . . . . . . . . . . . . . . . . . . . . . . . Perform Channel Wrap Test. . . . . . . . . . . . . . . . . . . . . . . . . . . . . . . . . . . . . . . . . . Swapping Ports . . . . . . . . . . . . . . . . . . . . . . . . . . . . . . . . . . . . . . . . . . . . . . . . . . . . . . . Collecting Maintenance Data . . . . . . . . . . . . . . . . . . . . . . . . . . . . . . . . . . . . . . . . . . . . Clean Fiber-Optic Components . . . . . . . . .
Contents RRP: Cooling Fan . . . . . . . . . . . . . . . . . . . . . . . . . . . . . . . . . . . . . . . . . . . . . . . . . . . . . Removal. . . . . . . . . . . . . . . . . . . . . . . . . . . . . . . . . . . . . . . . . . . . . . . . . . . . . . . . . . Replacement . . . . . . . . . . . . . . . . . . . . . . . . . . . . . . . . . . . . . . . . . . . . . . . . . . . . . . RRP: CTP Card - Switch Replacement . . . . . . . . . . . . . . . . . . . . . . . . . . . . . . . . . . . . . Replacing a Failed Switch .
1–10 1–11 1–12 1–13 1–14 1–15 1–16 1–17 1–18 1–19 1–20 1–21 1–22 3–1 3–2 3–3 3–4 3–5 3–6 3–7 3–8 3–9 3–10 3–11 3–12 3–13 3–14 3–15 3–16 3–17 3–18 3–19 5–1 5–2 Product View . . . . . . . . . . . . . . . . . . . . . . . . . . . . . . . . . . . . . . . . . . . . . . . . . . 1–23 Hardware View . . . . . . . . . . . . . . . . . . . . . . . . . . . . . . . . . . . . . . . . . . . . . . . . 1–25 Hardware View . . . . . . . . . . . . . . . . . . . . . . . . . . . . . . . . . . . . . . . . . . . . . . . .
Contents Tables 1–1 1–2 1–3 2–1 2–2 2–3 3–1 4–1 5–1 5–2 5–3 Status Symbols . . . . . . . . . . . . . . . . . . . . . . . . . . . . . . . . . . . . . . . . . . . . . . . . 1–24 Operating Status - Status Bar and Switch Status Table . . . . . . . . . . . . . . . . . 1–36 HAFM Services Status Symbols. . . . . . . . . . . . . . . . . . . . . . . . . . . . . . . . . . . 1–40 Factory-Set Defaults . . . . . . . . . . . . . . . . . . . . . . . . . . . . . . . . . . . . . . . . . . . . . 2–1 MAP Summary . . . . . .
About this Guide This manual describes the service procedures for the hp StorageWorks edge switch 2/16. Intended Audience This publication is intended for service personnel, and any individuals who monitor, configure, and repair the edge switch 2/16.
About this Guide • hp StorageWorks edge switch 2/16 product manager user guide, A7284-96003/AA-RS2KA-TE • hp StorageWorks edge switch 2/16 release notes, A7284-96004/AV-RSU3A-TE • hp StorageWorks edge switch rack mount installation instructions, A7283-96004/AA-RT4MA-TE • hp StorageWorks HAFM server installation guide, A6582-96001/AA-RT4KA-TE • hp StorageWorks ha-fabric manager user guide, A6534-96024/AA-RS2CA-TE • hp StorageWorks ha-fabric manager release notes, A6575-96004/AV-RQZJC-TE • hp St
About this Guide Symbols in Text These symbols may be found in the text of this manual. They have the following meanings. WARNING: Text set off in this manner indicates that failure to follow directions in the warning could result in bodily harm or loss of life. CAUTION: Text set off in this manner indicates that failure to follow directions could result in damage to equipment or data. IMPORTANT: Text set off in this manner presents clarifying information or specific instructions.
About this Guide Any surface or area of the equipment marked with these symbols indicates the presence of a hot surface or hot component. Contact with this surface could result in injury. WARNING: To reduce the risk of injury from a hot component, allow the surface to cool before touching. Power supplies or systems marked with these symbols indicate the presence of multiple sources of power.
About this Guide Getting Help If you still have a question after reading this manual, contact an HP authorized service provider or access our website: http://thenew.hp.com. HP Technical Support In North America, call technical support at 1-800-652-6672, available 24 hours a day, 7 days a week. NOTE: For continuous quality improvement, calls may be recorded or monitored. Outside North America, call technical support at the nearest location.
1 General InformationI The hp StorageWorks edge switch 2/16 provides dynamic switched connections between Fibre Channel servers and devices in a storage area network (SAN) environment. SANs introduce the concept of server-to-device networking and multi-switch fabrics, eliminate requirements for dedicated connections, and enable the enterprise to become data centric. A SAN provides speed, high capacity, and flexibility for the enterprise, and is primarily based upon Fibre Channel architecture.
General InformationI Multiple switches and the HAFM server communicate on a local area network (LAN) through one or more 10/100Base-T Ethernet hubs. One or more 12-port Ethernet hubs are optional and can be ordered with the switch. Up to three hubs are daisy-chained as required to provide additional Ethernet connections as more switches (or other Hewlett Packard managed products) are installed on a customer network. Figure 1–1 illustrates the switch, HAFM server, and Ethernet hub.
General InformationI Switch Management Out-of-band (non-Fibre Channel) management access to HP products is provided through an Ethernet LAN connection to a switch front panel. The following out-of-band management access methods are provided: • Management through the HAFM application. The HAFM application includes the edge switch 2/16 Product Manager application. This GUI resides on the HAFM server and provides a single point of management for all directors and switches.
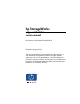
General InformationI 2 10/100 Mbps Corporate LAN 3 1 ProCurve 10/100 HP J3294A Hub 12 Power Fault Reset 1 2 3 4 5 6 Link 100 7 8 9 10 11 12 Link 100 Act Port 1 Only Col MDI-X MDI (out) (in) 1 2X 3X 4X 5X 6X 7X 8X 9X 10X 11X 12X 4 Internet Connection StorageWorks director 2/64 10/100 RST PWR ERR 6 5 SHR-2314d 1 2 3 SNMP management workstation Remote user workstation HP Ethernet hub 4 5 6 HAFM server Web browser Edge switch 2/16 Figure 1–2: Out-of-Band Produ
General InformationI Figure 1–3 on page 1-5 illustrates inband product management. In the figure, the managed product is an edge switch 2/16.
General InformationI • Diagnostic software that performs power-on self-tests (POSTs) and port diagnostics (internal loopback, external loopback, and Fibre Channel (FC) wrap tests). The FC wrap test applies only when the switch is configured to operate in S/390 mode. • Automatic notification of significant system events (to support personnel or administrators) through e-mail messages or the call-home feature.
General InformationI • Simple network management protocol (SNMP) management using the Fibre Alliance MIB that runs on the HAFM server. Up to 12 authorized management workstations can be configured through the HAFM application to receive unsolicited SNMP trap messages. The trap messages indicate operational state changes and failure conditions.
General InformationI Multi-Switch Fabrics A Fibre Channel topology that consists of one or more interconnected switches or switch elements is called a fabric. Operational software provides the ability to interconnect switches (through expansion port (E_Port) connections) to form a multi-switch fabric. The data transmission path through the fabric is typically determined by fabric elements and is user-transparent.
General InformationI the creation of a single fabric. A segmented link transmits only Class F traffic; the link does not transmit Class 2 or Class 3 traffic. The following conditions cause ports to segment: — Incompatible operating parameters - either the resource allocation time-out value (R_A_TOV) or error-detect time-out value (E_D_TOV) is inconsistent between switches. To prevent port segmentation, the same E_D_TOV and R_A_TOV must be specified for each switch.
General InformationI Weight: 26 pounds (11.8 kilograms) Power Requirements: Input voltage: 100 to 230 VAC Input Frequency: 47 to 63 Hz Plan for single phase or phase-to-phase connections and 5-ampere dedicated service Airflow Clearance in Rack: Sides: None Top and Bottom: None Front and Rear: 3.0 inches (7.
General InformationI 5% to 80% Maximum wet-bulb temperature: 84° F (29° C) Altitude: 40,000 feet (12,192 meters) Operating Environment Temperature: 40° F to 104° F (4° C to 40° C) Relative humidity: 8% to 80% Maximum wet-bulb temperature: 81° F (27° C) Altitude: 10,000 feet (3,048 meters) HAFM Server Description The HAFM server (Figure 1–1) is a notebook personal computer (PC) that provides a central point of control for up to 48 LAN-connected directors or edge switches.
General InformationI Figure 1–4: HAFM Server The server is mounted in a slide-out drawer in an HP-supplied equipment rack. The HAFM server or Internet access to the embedded web server interface is required to install, configure, and manage the switch. Although a configured switch operates normally without HAFM server intervention, an attached server should operate at all times to monitor switch operation, log events and configuration changes, and report failures.
General InformationI • Eighteen gigabyte (GB) or greater internal hard drive. • 160 megabyte (MB) or greater RAM. • Removable DVD/CD-ROM drive. • Removable 100 MB disk (Zip®) drive. • 56K internal modem. • One internal 10/100 Mbps Ethernet adapter with RJ-45 connector (provides public LAN interface to switches and remote clients). Ethernet Hub The HAFM Server and managed switches connect through a rack- mounted 10/100 Base-T Ethernet hub. Figure 1–5 illustrates the optional 12-port hub.
General InformationI • System event information displays at the attached HAFM server, a remote workstation communicating with the HAFM server, or the embedded web server interface. • LEDs on the switch front panel or FRUs illuminate to indicate a hardware malfunction. • An unsolicited SNMP trap message is received at a management workstation, indicating an operational state change or failure.
General InformationI Each remote workstation must have access to the LAN segment on which the HAFM server is installed. Switch administrative functions are accessed through the LAN and HAFM server. The LAN interface can be: • Part of the customer’s public 10/100 Mbps LAN segment that provides access to managed switches. This switch-to-HAFM server LAN connection is part of the equipment rack installation and is required. Connection of remote workstations through the hub is optional.
General InformationI • Part of a second HAFM server interface that connects to a customer’s private intranet and allows operation of the product manager application from remote user PCs or workstations. Connection to this LAN segment is optional and depends on customer requirements. A network configuration using both Ethernet connections is shown in Figure 1–7.
General InformationI • Desktop or notebook PC with color monitor, keyboard, and mouse, using an Intel Pentium® processor with a 400 MHz or greater clock speed, and using the Microsoft Windows® 95, Windows® 98, Windows® 2000, Windows XP, or Linux 2.2 operating system. • UNIX workstation with color monitor, keyboard, and mouse, using a: — Hewlett-Packard® HA PA-RISC® processor with a 400 MHz or greater clock speed, using the HP-UX® 11 or higher operating system.
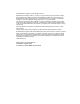
General InformationI StorageWorks edge switch 2/16 IML PWR ERR 1 5 6 7 2 3 4 6 5 8 Port LEDs 9 Error LED (amber) 10 Power LED (green) Initial machine load (IML) button Ethernet LAN connector SFP fiber optic connectors Figure 1–8: Edge Switch 2/16 (front view) 3 2 3 2 4 1 1 2 Cooling fan (4) Power supply (2) 3 4 Power switches on power supplies (2) RS-232 maintenance port Figure 1–9: Edge Switch 2/16 (rear view) Figure 1–9 illustrates the rear of the switch.
General InformationI SFP Transceivers A single-mode or multi-mode fiber-optic cable attaches to a port through a pluggable small form factor (SFP) transceiver. The SFP provides a duplex LC interface, and can be detached from the switch port for easy replacement. Two fiber-optic transceiver types are available: • Shortwave laser—Shortwave laser SFPs provide short-distance connections (2 to 500 meters) through 50-micron or 62.5-micron multi-mode fiber.
General InformationI • RS-232 maintenance port. Initial Machine Load Button When the IML button (Figure 1–8) is pressed and held for three seconds, the switch performs an IML that takes approximately 30 seconds and resets the: • Microprocessor and functional logic for the CTP card and loads firmware from FLASH memory. • Ethernet LAN interface, causing the connection to the HAFM server to drop momentarily until the connection automatically recovers.
General InformationI FRU Status LEDs Amber and green LEDs associated with switch FRUs provide status information as follows: • Port SFP - Amber and green LEDs to the left of the port (Figure 1–8) illuminate, extinguish, or blink to indicate various port states (operational with active Fibre Channel traffic, operational but not communicating, beaconing, blocked, failed, inactive, or running diagnostics).
General InformationI • E-mail messages or call-home reports from the HAFM server provide automatic notification of significant system events to designated support personnel or administrators. HAFM Diagnostics The HAFM application provides a Java-based GUI to manage, monitor, and isolate problems for multiple switches and multi-switch fabrics. The user interface operates locally on the HAFM server, or through an Ethernet LAN connection from a remote user workstation.
General InformationI Figure 1–10: Product View HAFM Status Symbols A status bar at the bottom of the Product View displays a colored symbol that indicates the worst-case status of any managed product in the Product View, that fabrics are persisted in the Fabrics View (double-click the Fabrics tab), and the status of the HAFM server. Table 1–1 illustrates and explains the meaning of the status symbols.
General InformationI A label below each icon identifies the switch by its configured name or IP address, and a colored status symbol beside each icon indicates the operational status of the switch. Table 1–1: Status Symbols Alert Symbol Green circle Meaning Status Bar: All managed products are fully operational and no failures are indicated. Next to Icon: The switch is fully operational and no failures are indicated. Yellow triangle Status Bar: At least one managed product is operating in degraded mode.
General InformationI • Help Click one of the tabs to display a list of menu options. Click an option to open a dialog box that allows you to perform configuration and maintenance tasks and view logs. If a menu option contains a check box, click in the box to add a check mark and enable a function. Click a check box containing a check mark to remove the check mark and disable the function.
General InformationI • Observe the operational status and state, name, description, and location for the selected switch at the status table at the top of the Hardware View. • Observe green and amber LEDs that illuminate on graphical FRUs. These LEDs emulate LED operation on corresponding switch FRUs. • Observe graphical FRUs that emulate the hardware configuration and operational status of the corresponding switch. Colored symbols appear on graphical FRUs to represent failed or degraded status.
General InformationI • Online - when the switch is set online, an unblocked port and all unbypassed ports are awaiting device login and are able to attach to a device. This state is configured through the Set Online State dialog box or following an IML. • Offline - when the switch is set offline, all ports are offline and cannot accept a login from an attached device that requires a switch connection. This state is configured through the Set Online State dialog box.
General InformationI • Attention indicator - a yellow triangle overlaying the top of a port SFP indicates the port is in a nonstandard mode or configuration, but did not actually fail. The indicator appears for any port having a state other than online, failed, blocked, bypassed, or loss of light. The indicator also appears to indicate a link incident (LIN) alert or a segmented port.
General InformationI Figure 1–12: Hardware View In the Hardware View, colored indicators reflect the status of actual LEDs on the switch FRUs. The status bar displays a symbol to represent the most degraded status currently reported by any of the switch FRUs. For example, for a port failure, indicated by a blinking red and yellow diamond on a port, a yellow triangle displays on the status bar to indicate a degraded condition.
General InformationI Port Menu Double-click a port to display the Port Properties dialog box.
General InformationI Figure 1–13: Port List View The Port List View displays information about all ports installed in the switch. All data is dynamic and updates automatically. Double-click any row in this view to display the Port Properties dialog box for the port. Right-click a port row to display the same menu options that display when you right-click a port in the Hardware View or a port’s bar graph in the Performance View.
General InformationI Note that these options are also available when you click a port row and select the Port secondary menu from the Product menu on the menu bar. FRU List View Select the FRU List view tab. A table with information about each of the FRUs installed in the switch displays in the view panel. All data is dynamic and updates automatically. Figure 1–14 shows an example of the FRU List View. Figure 1–14: FRU List View Node List View Select Node List from view tabs.
General InformationI columns that display in the table include: port number where the node is attached, the port’s address (S/390 mode only), node type, WWN of the attached node (device), and BB_Credit used by the attached node. Double-click a port row to highlight it and display the Node Properties dialog box for that port. Right-click a port row to display the following menu options: • Node Properties: Displays the Node Properties dialog box. • Port Properties: Displays the Port Properties dialog box.
General InformationI Performance View Select the Performance view tab from the menu. Figure 1–16 shows an example of the Performance View. This view provides a graphical display of performance for all 16 ports. The top portion of the Performance View displays bar graphs that show the level of transmit/receive activity for each port. This information updates every five seconds. Each bar graph also shows the percentage link utilization for the port.
General InformationI • Port Properties • Node Properties • Port Technology • Block Port • Enable Beaconing • Port Diagnostics • Channel Wrap (S/390 mode only) • Swap Ports (S/390 mode only) • Clear Link Incident Alert(s) • Reset Port • Port Binding • Clear Threshold Alert(s) Note that these same options are also available when you click a port’s graph, then select the Port secondary menu from the Product menu on the menu bar.
General InformationI Table 1–2: Operating Status - Status Bar and Switch Status Table Symb ol 1–36 Status Bar Switch Status Table Text Meaning Green Circle Fully Operational All components and installed ports are operational; no failures. Yellow Triangle Redundant Failure A redundant component has failed, such as a power supply, and the backup component has taken over operation. Minor Failure A failure occurred which has decreased the switch operational ability.
General InformationI Messages display to the right of the status symbol as you move the cursor over options under the menu bar menus. These messages provide additional details about tasks that you can perform through the menu option. Fabrics View Access the Fabrics View by clicking the Fabrics tab on the HAFM application window. The left panel of this view is the Fabric Tree, which is the expandable list of fabrics, products in fabrics, and nodes connected to products.
General InformationI wide name (WWN) of the fabric’s principal switch, but if the fabric is “persisted,” they could have various names configured by the user. The selected fabric’s name displays above the icons at the top of the tab. Zone Set Tab This tab displays the currently active zone set for fabrics that you select from the left side of the view. The zones and zone members that make up the zone set display in a scrollable tree structure below the name of the active zone set.
General InformationI The user interface consists of the HAFM Services window (Figure 1–19), which provides HAFM application status and diagnostic information. The HAFM Services window consists of: • An event table that displays HAFM Services events that occurred since the HAFM application was started. • A status line at the bottom of the panel that provides a status indicator and message area.
General InformationI • Viewed - this column provides a check box associated with each event. Each check box allows service personnel to mark an event as viewed (acknowledged with appropriate action taken). • Date/Time - the date and time the event was reported to the HAFM server. • Product - the product associated with the event. Some events are associated with the HAFM application, while others are associated with a specific instance of the product manager application.
General InformationI Embedded Web Server Diagnostics If the hp StorageWorks ha-fabric manager (HAFM) server access is not available, the embedded web server interface provides a GUI accessed through the Internet (locally or remotely) to manage, monitor, and isolate problems for a single switch. This interface is available with switch firmware Version 1.2 (or later) installed, and does not replace nor offer the full management capability of the HAFM and switch product manager applications.
General InformationI — Upgrade switch firmware. General tasks performed through the web server interface are similar in form and function to tasks performed through the HAFM and product manager applications, and are therefore not documented in this publication. For task information and descriptions, open the online user documentation (Help selection) that supports the interface. This publication provides instructions for switch installation and fault isolation using the embedded web server interface.
General InformationI For additional information, refer to the hp StorageWorks SNMP reference guide for director 2/64, edge switch 2/16, and edge switch 2/32 (A6534-96026/AA-RQ7BB-TE). E-Mail and Call-Home Support If e-mail notification and call-home support are configured for the switch as part of the customer support process, service personnel may be: • Notified of a switch problem by e-mail message, either directly or through a system administrator at the customer site or call center.
General InformationI • Fiber-optic protective plug - For safety and port transceiver protection, fiber-optic protective plugs must be inserted in all port SFPs without fiber-optic cables attached. The switch is shipped with protective plugs installed in all ports. A protective plug is shown in Figure 1–21.
General InformationI • Standard flat-tip and cross-tip (Phillips) screwdrivers - Screwdrivers are required to remove, replace, adjust or tighten various connector or chassis components, and to remove and replace power supplies. • Maintenance terminal (desktop or notebook PC) - the PC is required to configure switch network addresses and acquire event log information through the maintenance port.
2 Diagnostics This chapter describes diagnostic procedures used by service representatives to isolate hp StorageWorks edge switch 2/16 (edge switch 2/16) problems or failures to the field-replaceable unit (FRU) level. The chapter specifically describes how to perform maintenance analysis procedures (MAPs). Maintenance Analysis Procedures The MAPs provide fault isolation and related service procedures.
Diagnostics However, Table 2–3 lists the event codes and the corresponding MAPs. It is a quick start, if an event code is readily available.
Diagnostics Table 2–3: Event Codes versus Maintenance Action (Continued) Event Code Explanation Action 062 Maximum interswitch hop count exceeded. Go to MAP 0700. 070 E_Port is segmented. Go to MAP 0700. 071 Switch is isolated. Go to MAP 0700. 072 E_Port connected to an unsupported switch. Go to MAP 0700. 080 Unauthorized world wide name Go to MAP 0600 200 Power supply ac voltage failure. Go to MAP 0100. 201 Power supply DC voltage failure. Go to MAP 0100.
Diagnostics Table 2–3: Event Codes versus Maintenance Action (Continued) Event Code 2–4 Explanation Action 304 Fifth cooling fan failed. Go to MAP 0500. 305 Sixth cooling fan failed. Go to MAP 0500. 310 First cooling fan recovered. No action required. 311 Second cooling fan recovered. No action required. 312 Third cooling fan recovered. No action required. 313 Fourth cooling fan recovered. No action required. 314 Fifth cooling fan recovered . No action required.
Diagnostics Table 2–3: Event Codes versus Maintenance Action (Continued) Event Code Explanation Action 433 Non-recoverable Ethernet fault. Go to MAP 0400. 440 Embedded port hardware failure. Go to MAP 0600. 502 Port module anomaly detected. No action required. 504 Port module failure - error threshold exceeded. Go to MAP 0600. 505 Port module revision not supported. No action required. 506 Fibre Channel port failure. Go to MAP 0600. 507 Loopback diagnostics port failure.
Diagnostics Table 2–3: Event Codes versus Maintenance Action (Continued) Event Code 2–6 Explanation Action 585 Primitive sequence timeout. Go to MAP 0600. 586 Invalid primitive sequence received for link state. Go to MAP 0600. 602 SBAR module anomaly detected. No action required. 604 SBAR module failure. Go to MAP 0600. 605 SBAR module revision not supported. Go to MAP 0600. 800 High-temperature warning (port module thermal sensor). Go to MAP 0500.
Diagnostics MAP 0000: Start MAP This MAP describes initial fault isolation for the switch. Fault isolation begins at the hp StorageWorks ha-fabric manager (HAFM) server, failed switch, or Internet-connected personal computer (PC) running the embedded web server interface. 1 Prior to fault isolation, acquire the following information from the customer: • A system configuration drawing or planning worksheet that includes the HAFM server, switches, other Hewlett Packard products, and device connections.
Diagnostics • NO ↓ Display a Dr. Watson for Windows 2000 dialog box? YES An HAFM server application problem is indicated. Event codes are not recorded. Go to "MAP 0300: Console Application Problem Determination" on page 2-33. 4 Did the HAFM server crash and display a blue screen with the system dump file in hexadecimal format (blue screen of death)? NO ↓ YES An HAFM server application problem is indicated. Event codes are not recorded.
Diagnostics f. At the HAFM Login dialog box, type a user name, password, and HAFM server name (obtained in step 1, and all are case sensitive), and click Login. The application opens and the Product View displays. Did the Product View display and does the HAFM application appear operational? YES ↓ NO An HAFM server hardware problem is indicated. Event codes are not recorded. Go to "MAP 0800: Console PC Problem Determination" on page 2-90.
Diagnostics • The switch-to-HAFM server Ethernet link failed. • Ac power distribution in the switch failed. • The control processor (CTP) card failed. Because the CTP card is not a FRU, CTP failure requires replacing the switch. Does a grey square appear at the alert panel and as the background to the icon representing the switch reporting the problem? YES ↓ NO Go to step 10. 8 At the switch reporting the problem, ensure the power switch is set to the Power On (1) position.
Diagnostics ↓ Go to step 14. 11 Click the icon representing the switch reporting the problem. The Hardware View displays. At the Hardware View: • Observe whether the edge switch 2/16 Status table is yellow and switch status is NOT OPERATIONAL. • Inspect FRUs for a blinking red and yellow diamond (failed FRU indicator) that overlays a FRU graphic. Does a blinking red and yellow diamond overlay a Fibre Channel port graphic? NO ↓ YES A port SFP failure is indicated. Go to step 23 to obtain event codes.
Diagnostics • Observe whether the edge switch 2/16 Status table is yellow and switch status is Minor Failure or Not Installed. • Inspect FRUs for a blinking red and yellow diamond (failed FRU indicator) that overlays the FRU graphic. Does a blinking red and yellow diamond overlay a Fibre Channel port graphic? NO ↓ YES A port SFP failure is indicated. Go to step 23 to obtain event codes. If no event codes are found, go to "MAP 0600: Port Failure and Link Incident Analysis" on page 2-63.
Diagnostics a. At the Hardware View, click the port graphic with the attention indicator. The Port Properties dialog box displays. b. Inspect the Beaconing and Operational State fields. Does the Operational State field display a Beaconing message and the Beaconing field display an On message? YES ↓ NO Go to step 21. 20 Port beaconing is enabled. a. Consult with the customer and next level of support to determine the reason port beaconing is enabled. b. Disable port beaconing: 1.
Diagnostics Go to step 2. 21 At the Port Properties dialog box, does the Operational State field display a Segmented E_Port message? NO ↓ YES E_Port segmentation is indicated. Go to step 23 to obtain event codes. If no event codes are found, go to "MAP 0700: Fabric, ISL, and Segmented Port Problem Determination" on page 2-79. A message displays indicating a link incident or port problem. Go to step 23 to obtain event codes.
Diagnostics Link interface incident - bit-error threshold exceeded. Link failure - loss of signal or loss of synchronization. Link failure - not-operational primitive sequence (NOS) received. Link failure - primitive sequence timeout. Link failure - invalid primitive sequence received for the current link state. Did one of the listed messages appear in the Link Incident Log? YES ↓ NO The switch appears operational. A link incident problem is indicated. Go to step 23 to obtain event codes.
Diagnostics 24 Are you at the switch reporting the problem? YES ↓ NO Go to step 36. 25 Is the PWR LED at the switch front panel illuminated? NO ↓ YES Go to step 30. 26 Is the power switch set to the Power On (1) position? NO ↓ YES Go to step 29. 27 Power on the switch. Inspect the switch for indications of being powered on, such as: • At the front panel, an illuminated PWR or ERR indicator. • Green LEDs illuminated on the power supplies. • Audio emanations and airflow from fans.
Diagnostics a. If continued operation without benefit of the PWR LED is acceptable to the customer, do not perform any repair action. b. If continued operation without benefit of the PWR LED is not acceptable to the customer, remove and replace the switch. 29 Inspect the switch for indications of being powered on, such as: • At the front panel, an illuminated PWR or ERR indicator. • Green LEDs illuminated on the power supplies. • Audio emanations and airflow from fans.
Diagnostics 2. Click Enable Unit Beaconing. The check mark disappears from the box adjacent to the option, and unit beaconing is disabled. Was unit beaconing enabled because an switch failure or degradation was suspected? YES ↓ NO The switch appears operational. Go to step 25. 32 Is the ERR LED illuminated? YES ↓ NO The switch appears operational. Verify operation at the HAFM server. Go to step 3. 33 Check FRUs (port SFPs, fans, power supplies) for failure symptoms.
Diagnostics The switch appears operational. 36 Are you at a PC with a web browser (such as Netscape Navigator or Microsoft Internet Explorer) and an Internet connection to the switch reporting the problem. YES ↓ NO Go to step 52. 37 Is the web browser PC powered on and communicating with the switch through the Internet connection? NO ↓ YES Go to step 39. 38 Boot the web browser PC. a. Power on the PC in accordance with the instructions delivered with the PC. The Windows desktop appears. b.
Diagnostics 39 Does the embedded web server interface appear operational with the view panel displayed? NO ↓ YES Go to step 44. 40 A Page cannot be found, Unable to locate the server, HTTP 404 - file not found, or other similar message appears. The message indicates the web browser PC cannot communicate with the switch because: • The switch-to-PC Internet link could not be established. • AC power distribution in the switch failed, or AC power was disconnected. • The switch’s CTP failed.
Diagnostics Does the switch appear powered on? YES ↓ NO A power distribution problem is indicated. Go to "MAP 0100: Power Distribution Analysis" on page 2-26. 42 Either a switch-to-PC Internet link problem (Internet too busy or IP address typed incorrectly) or a CTP card failure is indicated. a. Wait approximately five minutes, then attempt to login to the switch again. b. At the Netsite field (Netscape Navigator) or Address field (Internet Explorer), type http://xxx.xxx.xxx.xxx, where xxx.xxx.xxx.
Diagnostics Does the Operational State field display a Beaconing message and the Beaconing field display an On message? YES ↓ NO Go to step 46. 45 Port beaconing is enabled. a. Consult the customer and next level of support to determine the reason port beaconing is enabled. b. Disable port beaconing: 1. At the View panel, select Operations at the left side of the panel. The Operations panel opens with the Port Beaconing page displayed. 2. Click the Beaconing State check box for the port.
Diagnostics 3. Return to the View panel (Port Properties tab). Continue. 46 At the View panel, does the Operational State field display a Segmented message? NO ↓ YES Port segmentation is indicated. Go to step 51 to obtain event codes. If no event codes are found, go to "MAP 0700: Fabric, ISL, and Segmented Port Problem Determination" on page 2-79. 47 At the View panel, does the Operational State field display a message indicating a link incident or port problem? NO ↓ YES A port problem is indicated.
Diagnostics Does the State field display a Failed message for either power supply? NO ↓ YES A power supply failure is indicated. Go to step 51 to obtain event codes. If no event codes are found, go to "MAP 0100: Power Distribution Analysis" on page 2-26. 50 Inspect the State fields for Fan 0, and Fan 1 through Fan 3 (fans). Does the State field display a Failed or Not Installed message for any of the fans? YES ↓ NO The switch appears operational. A fan failure is indicated.
Diagnostics a. At the View panel, select Monitor at the left side of the panel. The Monitor panel opens with the Status page displayed. b. At the Monitor panel, click the Log tab. The Monitor panel (Log tab) displays. c. Record the event code, date, time, and severity (Informational, Minor, Major, or Severe). d. Record all event codes that may relate to the reported problem. Were one or more event codes found? YES ↓ NO Return to the MAP step that sent you here. Go to Table 2–3 on page 2-2.
Diagnostics 584 - Link failure - not-operational primitive sequence (NOS) received. 585 - Link failure - primitive sequence timeout. 586 - Link failure - invalid primitive sequence received for the current link state. Were one or more event codes found? YES ↓ NO Perform switch fault isolation at the HAFM server. Go to step 3. Go to Table 2–3 on page 2-2.
Diagnostics ↓ Remote fault isolation is being performed through the embedded web server interface. Go to step 20. 4 Does inspection of a power supply indicate a failure (green LED extinguished)? NO ↓ YES Go to step 6. 5 Does a blinking red and yellow diamond (failed FRU indicator) appear to overlay a power supply graphic at the HAFM server Hardware View? YES ↓ NO Go to step 11. 6 A redundant power supply is disconnected from facility AC power, not properly installed, or has failed.
Diagnostics ↓ The switch appears operational. 8 Ensure the power supply is correctly installed and seated in the CTP card. If required, partially remove and reseat the power supply. Was a corrective action performed? YES ↓ NO Go to step 10. 9 Verify power supply operation. a. Inspect the power supply and ensure the green LED illuminates. b. At the Hardware View, observe the graphic representing the power supply and ensure a failure symbol (blinking red and yellow diamond) does not appear.
Diagnostics • The switch-to-HAFM server Ethernet link failed. • AC power distribution in the switch failed, or AC power was disconnected. • The switch’s CTP failed. Because the CTP card is not a FRU, CTP failure requires replacing the switch. YES ↓ NO The switch appears operational. 12 Ensure the power switch is set to the Power On (1) position. Inspect the switch for indications of being powered on, such as: • At the front panel, an illuminated PWR or ERR indicator.
Diagnostics a. Inspect the power supplies and ensure the green LEDs illuminate. b. At the Hardware View, observe the graphics representing the power supplies and ensure a failure symbol (blinking red and yellow diamond) does not appear. Is a failure indicated? YES ↓ NO The switch appears operational. 15 Ensure both power supplies are correctly installed and seated in the CTP card. If required, partially remove and reseat the power supplies. Was a corrective action performed? YES ↓ NO Go to step 17.
Diagnostics 18 Both power supplies failed and must be removed and replaced (RRP: Power Supply on page 4-4). Perform the data collection procedure after FRU removal and replacement. Did replacement of both power supplies solve the problem? NO ↓ YES The switch appears operational. Contact the next level of support. 19 One or both power supplies appear operational, but the CTP card is not receiving DC power. An in-card circuit breaker may have tripped due to a power surge or the CTP card failed.
Diagnostics 22 Inspect the power supply operational states at the embedded web server interface. a. At the View panel, click the Component Properties tab. The View panel (Component Properties tab) displays. b. Inspect the State fields for Power Supply 0 and Power Supply 1. Does the State field display a Failed or Not Installed message for either power supply? NO ↓ YES A redundant power supply failure is indicated. Go to step 6. The switch appears operational.
Diagnostics 2 The following table lists event codes, brief explanations of the codes, and the associated steps that describe fault isolation procedures. Event Code Explanation Action 400 Power-up diagnostic failure. Go to step 3. 411 Firmware fault occurred. Go to step 4. 3 POST/IPL diagnostics detected a CTP card failure as indicated by an event code 400 with supplementary bytes of event data. • Byte 0 is a FRU code (02) that indicates a failed CTP card.
Diagnostics ↓ Go to step 4. 2 An application or operating system problem is indicated. Close the HAFM application. a. Simultaneously press Ctrl, Alt, and Delete. The Windows Security dialog box displays. b. At the Windows Security dialog box, click Task Manager. The Windows Task Manager dialog box displays with the Applications page open. c. Select (highlight) the hp StorageWorks ha-fabric manager (HAFM) application entry and click End Task. The HAFM application closes. Continue.
Diagnostics f. At the HAFM Login dialog box, type a user name, password, and HAFM server name (obtained in "MAP 0000: Start MAP" on page 2-7) and click Login. The application opens and the Product View displays. Did the Product View display and does the HAFM application appear operational? NO ↓ YES The problem is transient and the HAFM server appears operational. Contact the next level of support.
Diagnostics 5 Did the HAFM application display a dialog box with the message The software version on this HAFM server is not compatible with the version on the remote HAFM server? YES ↓ NO Go to step 8. 6 The HAFM applications running on the HAFM server and client workstation are not at compatible release levels. Recommend to the customer that the downlevel version be upgraded. Does the customer want the HAFM application upgraded? YES ↓ NO Power off the client workstation.
Diagnostics 10 An attempt to download a firmware version from the HAFM server hard drive to the switch failed. Retry the operation ("Manage Firmware Versions" on page 3-40). Did the firmware version download to the switch? NO ↓ YES The HAFM server appears operational. A CTP card failure is suspected. Go to "MAP 0000: Start MAP" on page 2-7 to isolate the problem. 11 Did the product manager application display a dialog box with the message The data collection process failed? YES ↓ NO Go to step 13.
Diagnostics NO ↓ YES A Windows operating system or HAFM application error occurred. Click Cancel to close the dialog box and HAFM application. Go to step 3. 14 Did the HAFM server crash and display a blue screen with the system dump file in hexadecimal format (blue screen of death)? YES ↓ NO The HAFM server appears operational. 15 Attempt to clear the problem by power cycling the HAFM server PC. a. Power off the PC. b. Wait approximately 30 seconds and power on the PC.
Diagnostics Did the Product View display and does the HAFM application appear operational? NO ↓ YES The problem is transient and the HAFM server appears operational. Contact the next level of support. MAP 0400: Loss of Console Communication This MAP describes fault isolation of the Ethernet communication link between a switch and the HAFM server, or between a switch and a web browser PC running the embedded web server interface.
Diagnostics • At the web browser PC, A Page cannot be found, Unable to locate the server, HTTP 404 - file not found, or other similar message. • An event code 433 recorded only in nonvolatile random-access memory (NV-RAM) on the switch’s CTP card. • An event code 430, 431, 432, 440 recorded at the switch Event Log or embedded web server event log.
Diagnostics Click HAFM Services at the Windows task bar. The HAFM Services window displays. Is the HAFM server powered on and the HAFM application running? YES ↓ NO Go to step 4. 3 Did the switch-to-HAFM server Ethernet connection recover? NO ↓ YES The switch-to-HAFM server connection is restored and appears operational. Contact the next level of support. 4 Reboot the HAFM server PC. a. Click the Windows Start button. The Windows Workstation menu displays. b.
Diagnostics e. Simultaneously press Ctrl, Alt, and Delete to display the Logon Information dialog box. Type a user name and password (obtained in "MAP 0000: Start MAP" on page 2-7) and click OK. The HAFM application starts and the HAFM Login dialog box displays. f. At the HAFM Login dialog box, type a user name, password, and HAFM server name (obtained in "MAP 0000: Start MAP" on page 2-7), and click Login. The application opens and the Product View displays.
Diagnostics ↓ Remote fault isolation is being performed through the embedded web server interface. Go to step 25. 6 At the Product View, does a grey square appear at the alert panel and as the background to the icon representing the switch reporting the problem? YES ↓ NO The switch-to-HAFM server connection is restored and appears operational. The grey square indicates the HAFM server cannot communicate with the switch because: • The switch-to-HAFM server Ethernet link failed.
Diagnostics • The switch Status table is yellow, the Status field displays No Link, and the Reason field displays an error message. The following table lists the error messages and associated steps that describe fault isolation procedures. Error Message Action Never connected. Go to step 9. Link timeout. Go to step 9. Protocol mismatch. Go to step 15. Duplicate session. Go to step 18. Unknown network address. Go to step 21. Incorrect product type. Go to step 23.
Diagnostics Was a corrective action performed? NO ↓ YES Go to step 1. 12 Verify operation of the Ethernet hub or hubs. Inspect each hub for indications of being powered on, such as: • Green Power LED illuminated. • Green Status LEDs illuminated. Is a hub failure indicated? YES ↓ NO Go to step 14. 13 Replace the Ethernet hub. Refer to the supporting documentation shipped with the hub for instructions.
Diagnostics 15 The HAFM application (running on the HAFM server) and the firmware running on the switch are not at compatible release levels. Recommend to the customer that the downlevel version (software or firmware) be upgraded. Does the HAFM application require upgrade? YES ↓ NO Go to step 17. 16 At the HAFM server, upgrade the HAFM application ("Install or Upgrade Software" on page 3-51).
Diagnostics YES ↓ NO Power off the HAFM server reporting the Duplicate Session communication problem. 19 Determine the internet protocol (IP) address of the HAFM server running the first instance of the HAFM application. a. Click the Windows Start button. The Windows Workstation menu displays. b. At the Windows Workstation menu, select Settings. From the menu that displays, select Control Panel. The Control Panel window displays. c. At the Control Panel window, double-click the Network icon.
Diagnostics h. Close the Control Panel window. Continue. 20 Configure the HAFM server reporting the Duplicate Session communication problem as a client. a. At the Product View, select Logout from the Logout/Exit menu on the navigation control panel. The HAFM Login dialog box displays. b. At the HAFM Login dialog box, type a user name and password (obtained in "MAP 0000: Start MAP" on page 3-7). c.
Diagnostics Contact the next level of support. 21 The IP address defining the switch to the HAFM application is incorrect or unknown and must be verified. A maintenance terminal (desktop or notebook PC) and asynchronous RS-232 modem cable are required to verify the switch IP address. Both tools are provided by installation or service personnel. To verify the switch IP address: a. Remove the protective cap from the 9-pin maintenance port at the rear of the switch (a flat-tip screwdriver may be required).
Diagnostics f. Type Edge-16 in the Name field and click OK. The Connect To dialog box displays. g. Ensure the Connect using field displays COM1 or COM2 (depending on the serial communication port connection to the switch) and click OK. The COMn dialog box displays (where n is 1 or 2). h. Configure the Port Settings parameters as follows: — Bits per second - 57600. — Data bits - 8.
Diagnostics — Parity - None. — Stop bits - 1. — Flow control - Hardware. When the parameters are set, click OK. The HyperTerminal window displays. i. At the > prompt, type the user-level password (the default is password) and press Enter. The password is case sensitive. The HyperTerminal window displays with software and hardware version information for the switch, and an C> prompt at the bottom of the window. j. At the C> prompt, type the ipconfig command and press Enter.
Diagnostics m. Click Yes. The following message box appears: n. Click No to exit and close the HyperTerminal application. o. Power off the maintenance terminal. p. Disconnect the RS-232 modem cable from the switch and the maintenance terminal. Replace the protective cap over the maintenance port. Continue. 22 Define the switch’s correct IP address to the HAFM server. a. At the Product View, right-click the icon with the grey square representing the switch reporting the problem. A pop-up menu displays. b.
Diagnostics b. Select Delete. A Warning dialog box displays asking if the product is to be deleted. c. Click Yes to delete the product. d. At the Product View, select New Product from the Configure menu on the navigation control panel. The New Product dialog box displays. e. Type the configured IP address in the Network Address field. f. Select Edge-16 from the Product Type list box and click OK.
Diagnostics 26 A Page cannot be found, Unable to locate the server, HTTP 404 - file not found, or other similar message appears. The message indicates the web browser PC cannot communicate with the switch because: • The switch-to-PC Internet (Ethernet) link could not be established. • AC power distribution in the switch failed, or AC power was disconnected. • The switch CTP card failed. Continue.
Diagnostics ↓ The switch-to-web server PC connection is restored and appears operational. 29 An unrecoverable Ethernet fault (reported as event code 433) is indicated. The event code is not reported to the switch Event Log or the embedded web server event log, and must be verified through the switch maintenance port. A maintenance terminal (desktop or notebook PC) and asynchronous RS-232 modem cable are required to verify the reporting of event code 433.
Diagnostics f. Type Edge-16 in the Name field and click OK. The Connect To dialog box displays. g. Ensure the Connect using field displays COM1 or COM2 (depending on the serial communication port connection to the switch), and click OK. The COMn dialog box displays (where n is 1 or 2). h. Configure the Port Settings parameters as follows: — Bits per second - 57600. — Data bits - 8.
Diagnostics — Parity - None. — Stop bits - 1. — Flow control - Hardware. When the parameters are set, click OK. The HyperTerminal window displays. i. At the C> prompt, type the user-level password (the default is password) and press Enter. The password is case sensitive. The HyperTerminal window displays with software and hardware version information for the switch, and a C> prompt at the bottom of the window. j. At the C> prompt, type the displaylog command and press Enter.
Diagnostics m. Click Yes. The following message box appears: n. Click No to exit and close the HyperTerminal application. o. Power off the maintenance terminal. p. Disconnect the RS-232 modem cable from the switch and the maintenance terminal. Replace the protective cap over the maintenance port. Was event code 433 reported? NO ↓ YES An unrecoverable Ethernet fault (CTP card failure) occurred. Because the CTP card is not a FRU, replace the switch. Contact the next level of support.
Diagnostics 1 Was an event code 300, 301, 302, 303, 304, 305, 306, 307; or 604, 605, 607; or 800, 801, 802, 805, 806, 807, 810, 811, 812, or 850 observed at the switch Event Log (HAFM server) or at the embedded web server event log? YES ↓ NO Go to step 3. 2 The following table lists event codes, brief explanations of the codes, and associated steps that describe fault isolation procedures. Event Code Explanation Action 300 First cooling fan failed. Go to step 8. 301 Second cooling fan failed.
Diagnostics Event Code Explanation Action 807 SBAR assembly shutdown due to thermal violation. Go to step 8. 810 High temperature warning (CTP card thermal sensor). Go to step 8. 811 Critically hot temperature warning (CTP card thermal sensor). Go to step 8. 812 CTP card shutdown due to thermal violation. Go to step 8. 850 System shutdown due to CTP card thermal violations. Go to step 8.
Diagnostics 6 Does the embedded web server interface appear operational? YES ↓ NO Analysis for an Ethernet link, AC power distribution, or CTP card failure is not described in this MAP. Go to "MAP 0000: Start MAP" on page 2-7. If this is the second time at this step, contact the next level of support. 7 Inspect the fan operational states at the embedded web server interface. a. At the View panel, click the Component Properties tab. The View panel (Component Properties tab) displays. b.
Diagnostics 10 Have the customer inspect and verify that facility power is within specifications. These specifications are: • One single-phase connection for each power supply. • Input power between 120 and 230 Vac. • Input current between 2 and 4 amps. • Input frequency between 47 and 63 Hz. Is facility power within specifications? YES ↓ NO Ask the customer to correct the facility power problem. When facility power is corrected, verify switch temperature cools to within the operational limit.
Diagnostics 14 The SBAR on the CTP card failed. Because the SBAR is not a FRU, SBAR failure requires replacing the switch. Contact the next level of support. MAP 0600: Port Failure and Link Incident Analysis This MAP describes fault isolation for small form factor pluggable (SFP) transceivers and Fibre Channel link incidents. Failure indicators include: • The amber LED adjacent to a Fibre Channel port illuminates. • The amber emulated LED adjacent to a port graphic at the Hardware View illuminates.
Diagnostics 3 The following table lists event codes, brief explanations of the codes, and associated steps that describe fault isolation procedures. Event Code Explanation Action 080 Unauthorized world wide name Go to step 21 440 Embedded port hardware failure. Go to step 11. 504 Port module failure - error threshold exceeded. Go to step 11. 506 Fibre Channel port failure. Go to step 11. 507 Loopback diagnostics port failure. Go to step 12. 508 Fibre Channel port anomaly detected.
Diagnostics NO ↓ YES Go to step 11. 6 Does a blinking red and yellow diamond (failed FRU indicator) appear to overlay a port graphic at the Hardware View? NO ↓ YES Go to step 11. 7 Did a Fibre Channel port fail a loopback test? NO ↓ YES Go to step 12. 8 Perform link incident or failure analysis for the port. Does a yellow triangle (attention indicator) overlay the port graphic at the Hardware View? YES ↓ NO Go to step 10. 9 Inspect the port state and LED (green and amber) status.
Diagnostics a. At the Hardware View, click the port graphic. The Port Properties dialog box displays. b. Inspect the Operational State field and the emulated green and amber LEDs adjacent to the port at the Hardware View. c. The following table lists LED and port operational state combinations, and associated MAP 0600 (or other) steps that describe fault isolation procedures. Operational State 2–66 Green LED Amber LED Action Port Failure Off On Go to step 11. Offline Off Off Go to step 14.
Diagnostics Operational State Green LED Amber LED Action Inactive Off Off See Reason Field of Port Properties dialog box. Not Installed Off Off The port optics are not installed or the feature that provides additional port function is not enabled. Invalid attachment On Off Go to step 16 Link Reset On Off Go to step 24. Link Incident Off Off Go to step 25. Segmented On Off Go to MAP 0700.
Diagnostics 11 A Fibre Channel port SFP failed and must be removed and replaced. a. Determine the type of SFP to be removed and replaced. This procedure is concurrent and can be performed while switch power is on (RRP: SFP Transceiver on page 4-2). b. Perform an external loopback test on the port SFP as part of FRU removal and replacement. c. Perform the data collection procedure as part of FRU removal and replacement. Did port SFP replacement solve the problem? NO ↓ YES The switch appears operational.
Diagnostics 13 The port SFP may be improperly seated in the chassis. Partially remove and reseat the SFP, then perform an external loopback test for the SFP. Did reseating the port SFP solve the problem? NO ↓ YES The switch appears operational. Go to step 11.
Diagnostics ↓ The switch appears operational. Go to step 4. 16 The port has an invalid attachment. The information in the Port Properties dialog box specifies the reason as listed in the following table. Reason Action Unknown Contact the next level of support. ISL connection not allowed on this port. Go to step 17. Incompatible switch at other end of ISL. Go to step 18. External loopback adapter connected to the port. Go to step 19. N-Port connection not allowed on this port. Go to step 17.
Diagnostics b. Use the vertical scroll bar as necessary to display the information row for the port indicating an invalid attachment. c. Select (click) the Type field and configure the port from the list box as follows: • Select fabric port (F_Port) if the port is cabled to a device (node). • Select expansion port (E_Port) if the port is cabled to a fabric element (director or switch) to form an ISL. d. Click the Activate button to save the configuration information and close the dialog box.
Diagnostics a. Ensure the switch is set offline. For instructions, refer to "Set Offline State" on page 3-38 and return here. b. At the Hardware View for the selected switch, click the Configure icon at the navigation control panel and select Operating Mode from the Configure menu. The Configure Operating Mode dialog box displays. c.
Diagnostics 20 Remove the loopback plug from the port receptacle. If directed by the customer, connect a fiber-optic jumper cable attaching a device to the switch. • If the port is operational and a device is not attached, both LEDs adjacent to the port extinguish and the port state is No Light. • If the port is operational and a device is attached, the green LED illuminates, the amber LED extinguishes, and the port state is Online.
Diagnostics 22 Clean the fiber-optic connectors on the cable. a. Notify the customer the port will be blocked. Ensure the customer’s system administrator stops Fibre Channel frame traffic through the port and sets the attached device offline. b. Block the port. Refer to "Block a Port" on page 3-39 for instructions. c. Disconnect both ends of the fiber-optic cable. d. Clean the fiber-optic connectors. Refer to "Clean Fiber-Optic Components" on page 3-33 for instructions. e. Reconnect the fiber-optic cable.
Diagnostics Did service of the HBAs solve the problem? NO ↓ YES Exit MAP. Contact the next level of support. Exit MAP. 24 The switch and attached fabric device are performing a Fibre Channel link reset. This is a transient state. Wait approximately 30 seconds and inspect port state and LED behavior. Did the link recover and resume operation? NO ↓ YES The Fibre Channel link and switch appear operational. Go to step 4.
Diagnostics ↓ The problem is transient. The Fibre Channel link and the switch appear operational. 26 Inspect the fiber-optic jumper cable attached to the port and ensure the cable is not bent and connectors are not damaged. If the cable is bent or connectors are damaged: a. Notify the customer the port will be blocked. Ensure the customer system administrator stops Fibre Channel frame traffic through the port and sets the attached switch or device offline. b. Block the port ("Block a Port" on page 3-39).
Diagnostics g. Monitor port operation for approximately five minutes. Did the link incident recur? YES ↓ NO The Fibre Channel link and switch appear operational. 29 Disconnect the fiber-optic jumper cable from the port and connect the cable to a spare port. Is a link incident reported at the new port? YES ↓ NO Go to step 31. 30 The attached device is causing the recurrent link incident. Notify the customer of the problem and have the system administrator: a.
Diagnostics 33 The switch primitive sequence timed out (event code 585) or an invalid primitive sequence was received for link state (event code 586). Either error causes the switch to automatically reinitialize the fabric. Attached devices may momentarily logout, login, and resume operation. If the problem persists, an attached device may be marginally operating and causing the error condition. Inform the customer of the problem.
Diagnostics 37 Does the Operational State field display a Port Failure message for any port? NO YES ↓ A port SFP failure is indicated. Go to step 11. The switch appears operational. MAP 0700: Fabric, ISL, and Segmented Port Problem Determination This MAP describes isolation of fabric logout, interswitch link (ISL), and port segmentation problems. Failure indicators include: • An event code recorded at the switch Event Log or the embedded web server event log.
Diagnostics 2 The following table lists event codes, brief explanations of the codes, and associated steps that describe fault isolation procedures. Event Code Explanation Action 011 Login server database invalid. Go to step 7. 021 Name server database invalid. Go to step 7. 051 Management server database invalid. Go to step 7. 052 Management server internal error. Go to step 7. 061 Fabric controller database invalid. Go to step 7. 062 Maximum interswitch hop count exceeded.
Diagnostics a. At the Hardware View, click the port graphic. The Port Properties dialog box displays. b. Inspect the Operational State field. Does the Operational State field indicate Segmented E_Port? YES ↓ NO Analysis for a port failure or other link incident is not described in this MAP. Go to "MAP 0600: Port Failure and Link Incident Analysis" on page 2-63. 6 Inspect the Reason field at the Port Properties dialog box.
Diagnostics 7 As indicated by an event code 052, a minor internal operating error was detected by the management server subsystem. The error caused management server databases to be re-initialized to an empty state. As a result, a disruptive server logout and login occurred for all attached devices. All attached devices resume operation after management server login. Perform the data collection procedure and return the Zip disk to Hewlett Packard for analysis.
Diagnostics c. Byte 0 specifies the port number (00 through 15) of the segmented E_port. Byte 4 specifies the segmentation reason as listed in the following table. Byte 3 Segmentation Reason Action 01 Incompatible operating parameters. Go to step 11. 02 Duplicate domain IDs. Go to step 12. 03 Incompatible zoning configurations. Go to step 13. 04 Build fabric protocol error. Go to step 14. 05 No principal switch. Go to step 19. 06 No response from attached switch (Hello Timeout).
Diagnostics d. At the Hardware View for the switch, select Operating Parameters from the Configure menu on the navigation control panel. The Configure Operating Parameters dialog box displays. e. Type the recommended E_D_TOV and R_A_TOV values, then click Activate. f. Repeat steps d and e at the Hardware View for the switch attached to the segmented switch. Use the same E_D_TOV and R_A_TOV values. g. Set both switches online ("Set Online State" on page 3-37).
Diagnostics d. At the Hardware View for the switch, select Operating Parameters from the Configure menu on the navigation control panel. The Configure Operating Parameters dialog box displays. e. Type the customer-determined preferred domain ID value, then click Activate. f. Repeat steps d and e at the Hardware View for the switch attached to the segmented E-Port (second switch). Use a different preferred domain ID value. g. Set both switches online ("Set Online State" on page 3-37).
Diagnostics b. Close the product manager application for the switch (Hardware View). The main HAFM window, or Product View (still active) displays. c. Select the Fabrics tab from the View menu. The Fabrics View displays with the default Topology tab active. d. Select the Zone Set tab at the bottom of the window. The Zone Set tab becomes active and displays the active zone set. e. Inspect zone names in the active zone set to determine the incompatible name. f.
Diagnostics 5. Select (highlight) the new zone name and drag (holding the left mouse button) the name to the Zones in Set list. 6. At the Zones in Set list, select (highlight) the zone name to be deleted, then drag (holding the left mouse button) the name off the Modify Zone Set dialog box. 7. At the Modify Zone Set dialog box, click Save Zone Set. The zone set (with the new zone name) is saved and the dialog box closes. 8.
Diagnostics ↓ The switches, associated ISL, and multi-switch fabric appear operational. Contact the next level of support. 16 The switch E_Port segmented because a response to a verification check indicates the attached switch is not operational. a. Perform the data collection procedure for the switch and return the Zip disk to Hewlett Packard for analysis. b. Go to "MAP 0000: Start MAP" on page 2-7 and perform fault isolation for the failed switch.
Diagnostics Segmentation Reason Action Build fabric protocol error. Go to step 14. No principal switch. Go to step 19. No response from attached switch. Go to step 16. 19 A switch E_Port segmented because no switch in the fabric is capable of becoming the principal switch. a. Notify the customer that the switch will be set offline. Ensure the system administrator quiesces Fibre Channel frame traffic through the switch and sets attached devices offline. b.
Diagnostics Contact the next level of support. MAP 0800: Console PC Problem Determination This MAP describes isolation of hardware-related problems with the HAFM server platform. Although this MAP provides high-level fault isolation instructions, refer to the documentation provided with the PC for detailed problem determination and resolution. 1 At the HAFM server, close the HAFM application. a. At the navigation control panel of the Product View, select Exit from the Logout/Exit icon.
Diagnostics d. Close the dialog box by clicking Close at the upper right corner of the window. Does the computer have sufficient memory? YES ↓ NO A memory upgrade is required. Inform the customer of the problem and contact the next level of support. 3 Reboot the HAFM server PC and perform system diagnostics. a. Click the Windows Start button. The Windows Workstation menu displays. b. At the Windows Workstation menu, select Shut Down. The Shut Down Windows dialog box appears. c.
Diagnostics NO ↓ YES A computer hardware problem exists. Refer to the supporting documentation shipped with the PC for instructions on resolving the problem. 4 After rebooting the PC, the HAFM application starts and the HAFM Login dialog box displays. Did the HAFM Login dialog box display? YES ↓ NO Go to step 6. 5 At the HAFM Login dialog box, type a user name, password, and HAFM server name (obtained in "MAP 0000: Start MAP" on page 2-7, and all are case sensitive), and click Login.
Diagnostics Did the Product View display and does the HAFM application appear operational? NO ↓ YES The PC appears operational. 6 Perform one of the following: • If the PC has standalone diagnostic test programs resident on the hard drive, perform the diagnostics. Refer to supporting documentation shipped with the PC for instructions. • If the PC does not have standalone diagnostic test programs resident on fixed disk, go to step 7.
Diagnostics ↓ The PC appears operational. 8 Re-install the HAFM application ("Install or Upgrade Software" on page 2-51). Did the HAFM application install and open successfully? NO ↓ YES The PC appears operational. 9 Advise the customer and next level of support that the PC hard drive should be formatted. If the customer and support personnel do not concur, go to step 10. a. Format the PC hard drive. Refer to supporting documentation shipped with the PC for instructions. b.
3 Repair Information isible Body Tag This chapter describes the repair and repair-related procedures for the hp StorageWorks edge switch 2/16 (edge switch 2/16), and associated field-replaceable units (FRUs). These procedures are described: • Obtaining log information at the hp StorageWorks ha-fabric manager (HAFM) server. • Displaying and using HAFM server views. • Obtaining and interpreting port diagnostic and performance data, and performing port diagnostic loopback tests.
Repair Information Factory Defaults Table 3–1 lists the defaults for the passwords, and IP, subnet, and gateway addresses. Table 3–1: Factory-Set Defaults Item Default Customer password password Maintenance password level-2 IP address 10.1.1.10 Subnet mask 255.0.0.0 Gateway address 0.0.0.0 Procedural Notes NOTE: HAFM and product manager screens in this manual may not match the screens on your server and workstation.
Repair Information Using Log Information The HAFM and switch product manager provide access to ten logs that provide information for administration, operation, and maintenance personnel. Each log stores up to 1,000 entries. The most recent entry appears at the top of a log. If a log is full, a new entry overwrites the oldest entry. Five logs are accessed through the HAFM application: • HAFM Audit Log. • HAFM Event Log. • Session Log. • Product Status Log.
Repair Information Information associated with a call-home failure is intended for maintenance personnel to fault isolate the problem (modem failure, no dial tone, etc.), while information provided in all other entries is generally intended for use by third-level support personnel to isolate more significant problems. To open the HAFM Event Log, select Event Log from the Logs menu on the navigation control panel.
Repair Information For a description of the Session Log and an explanation of button functions at the bottom of the log window, refer to the hp StorageWorks ha-fabric manager user guide (A6534-96024/AA-RS2CA-TE). Product Status Log The Product Status Log (Figure 3–2) records an entry when the status of a switch changes. The log reflects the previous status and current status of the switch, and indicates the instance of a switch product manager application that should be opened to investigate a problem.
Repair Information • The Date/Time column displays the date and time of the change in the fabric. • The Fabric Status Changed column displays the type of change in the fabric (for example, a switch was added or removed, an ISL was added or removed, the fabric was renamed or persisted, or a zone set became active). • The Description column displays a description of the change in the fabric.
Repair Information • Description - a brief description of the event. • Severity - the severity of the event (Informational, Minor, Major, or Severe). • FRU-Position - an acronym representing the FRU or non-FRU element, followed by a number representing the FRU or chassis position. The acronyms are: — SFP - Small form factor pluggable (SFP) optical transceiver. Chassis slots for SFPs inserted in a port are 0 through 15. The SFPs are FRUs. — PWR - power supply.
Repair Information Figure 3–4: Hardware Log To open the Hardware Log, select Hardware Log from the Logs menu on the navigation control panel. The log contains the following columns: • Date/Time - the date and time the FRU was inserted or removed. • FRU-Position - an acronym representing the FRU or non-FRU element, followed by a number representing the FRU or chassis position. The acronyms are: — SFP - Small form factor pluggable (SFP) optical transceiver.
Repair Information • Serial Number - the serial number of the inserted or removed FRU. Link Incident Log The Link Incident Log (Figure 3–5) displays a history of Fibre Channel link incidents and associated port numbers for the switch. The information is useful to maintenance personnel for isolating port problems and repair verification. To open the Link Incident Log, select Link Incident Log from the Logs menu on the navigation control panel.
Repair Information — Link failure - primitive sequence timeout. — Link failure - invalid primitive sequence received for current link state. Refer to "MAP 0600: Port Failure and Link Incident Analysis" on page -63 or "MAP 0700: Fabric, ISL, and Segmented Port Problem Determination" on page -79 for corrective actions in response to these link incident messages. Refresh the Link Incident Log To ensure recently-created link incidents appear in the Link Incident Log, periodically refresh the log display.
Repair Information Figure 3–6: Threshold Alert Log • Date/Time Date and time stamp for when the alert occurred. • Name Name for the alert as configured through the Configure Threshold Alerts dialog box. • Port Port number where the alert occurred. • Type The type of alert: transmit (TX) or receive (RX).
Repair Information Percent usage of traffic capacity. This is the percent of the port’s throughput capacity achieved by the measured throughput. This setting constitutes the threshold value and is configured through the Configure Threshold Alerts dialog box. For example, a value of 25 means that threshold occurs when throughput reaches 25 percent of the port’s capacity. • Alert Time The time that the utilization % must exist before an alert is generated.
Repair Information To open the Port List View, select Port List from the View menu on the navigation control panel. Figure 3–7: Port List View The port row provides status information in the following columns: • Port # - the port number (0 through 15). • Addr - the switch logical port address in hexadecimal format (S/390 operating mode only). • Name - the port name configured through the Configure Ports dialog box. • Blocked Config - the status (Blocked or Unblocked) of the port.
Repair Information • Alert - If link incident (LIN) alerts are configured for the port through the Configure Ports dialog box, a yellow triangle appears in the column when a link incident occurs. A yellow triangle also appears if beaconing is enabled for the port. A red and yellow diamond appears if the port fails. Click anywhere in the port row to open the Port Properties dialog box. Right-click anywhere in the port row to open a menu to: • Open the Port Properties dialog box.
Repair Information Figure 3–8: FRU List View To open the FRU List View from the Hardware View, click View and select FRU List. The FRU List View contains the following columns: • FRU-Position - an acronym representing the FRU or non-FRU element, followed by a number representing the FRU or chassis position. The acronyms are: — SFP - Small form factor pluggable (SFP) optical transceiver. Chassis slots for SFPs inserted in a port are 0 through 15. The SFPs are FRUs. — PWR - power supply.
Repair Information — THM - thermal sensor. The chassis slot is 0 (on the CTP card). The thermal sensor is not a FRU. • Position-a number representing the FRU chassis position. The chassis (slot) position for a nonredundant FRU is 0. The chassis positions for redundant FRUs are 0 and 1. • Status-the FRU status (Active or Backup). • Part Number-the FRU part number. • Serial Number-the FRU serial number.
Repair Information • Addr - the switch logical port address (05 through 13 inclusive) in hexadecimal format (S/390 operating mode only). • Node Type - the type of attached device. This information is supplied by the device (if supported). Node types include: — Unknown or other. — Hub, switch, gateway, or converter. — Host or host bus adapter (HBA). — Proxy agent. — Storage device or storage subsystem. — Module. — Software driver.
Repair Information To open the Zone Set view, click the Zone Set tab at the bottom of the Fabrics view on the HAFM main window. Figure 3–10: Zone Sets View Zone members appear as: • The unique 16-digit WWN identifying the device attached to the port. If a nickname is configured, the nickname appears instead. For example: 10:00:0206:77:43:B0:1C • A unique domain ID (1 through 15 inclusive) and port number (0 through 31).
Repair Information For a description of how to expand or collapse the active zone set list and an explanation of button functions at the bottom of the Zone Set View, refer to the hp StorageWorks ha-fabric manager user guide (A6534-96024/AA-RS2CA-TE). Performing Port Diagnostics Port diagnostics are performed at the switch and product manager application. These diagnostics include: • Inspecting port light-emitting diodes (LEDs) at the switch.
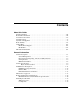
Repair Information Hardware View The Hardware View (Figure 3–11) displays a representation of and associated information about a specified switch. This information is useful to maintenance personnel for port-specific fault isolation and repair verification, link incidents, and port segmentation problems. • Port operational state information from the Port Properties dialog box (Figure 3–12). • Port LED behavior that emulates the operational status of the corresponding real switch.
Repair Information Figure 3–12: Port Properties Dialog Box The dialog box provides the following information: • Port Number - the switch port number (0 through 15). • Port Name - the user-defined name or description for the port. • Type - the type of port (G_Port if nothing is attached to the port, F_Port if a device is attached to the port, and E_Port if the port is connected to another switch as part of an ISL). • Fibre Channel Address - the Fibre Channel address identifier for the port.
Repair Information • LIN Alerts Configuration - a user-specified state for the port (On or Off), configured through the Configure Ports dialog box. • Beaconing - user-specified for the port (On or Off). When beaconing is enabled, a yellow triangle appears adjacent to the status field. • Link Incident - If no link incidents are recorded, None appears in the status field.
Repair Information • 03 ELP rejected by the attached switch. This director/switch transmitted an exchange link protocol (ELP) frame that was rejected by the switch at the other end of the ISL. • 04 Incompatible switch at the other end of the ISL. Interop mode for this switch is set to Open Fabric mode and the switch at the other end of the ISL is a Hewlett Packard switch configured for Homogeneous Fabric mode. • 05 External loopback adapter connected to the port. A loopback plug.
Repair Information Performance View The Performance View (Figure 3–13) displays statistical information about the performance of the ports. The information is useful for isolating port problems. To open the Performance View from the Hardware View, select Performance from the View menu on the navigation control panel. Figure 3–13: Performance View When the Performance View opens, no port statistics or errors appear.
Repair Information A red indicator on each port bar graph (high-water mark) remains at the highest level the graph has reached since the Performance View was opened. The indicator does not appear if the port is offline, and is reset to the bottom of the graph if the port detects a loss of light.
Repair Information • Error statistics. Click the Refresh button to update statistical information displayed on the Performance View for the selected port. Click the Clear button to reset the cumulative value counts to zero on the Performance View for the selected port. A confirmation dialog box displays before the values are cleared.
Repair Information 7. At the Diagnostics Test list box, select Internal Loopback. Figure 3–14: Port Diagnostics Dialog Box 8. Click Next. Beaconing initiates for the port selected for test. At the Hardware View, a yellow triangle appears at the top of the port. At the Port Diagnostics dialog box, the message Verify selected ports are beaconing appears. 9. Verify beaconing is enabled, then click Next.
Repair Information 13. Reset each tested port. External Loopback Test To perform an external loopback test for a single port: 1. Notify the customer that a disruptive external loopback test will be performed on a port and the fiber-optic cable or cables will be disconnected. Ensure the customer’s system administrator quiesces Fibre Channel frame traffic through the port and sets attached devices offline. NOTE: At the start of the loopback test, the port can be online, offline, blocked, or unblocked. 2.
Repair Information 10. Click Next. Beaconing initiates for the port selected for test. At the Hardware View, a yellow triangle appears at the top of the port. At the Port Diagnostics dialog box, the message Loopback plug(s) must be installed on ports being diagnosed appears. 11. Verify loopback plug(s) are installed and click Next. The message Verify selected ports are beaconing appears. 12. Verify beaconing is enabled, then click Next.
Repair Information 1. Notify the customer that a disruptive channel wrap test will be performed on a host-attached port. 2. At the HAFM server, open the HAFM application. The Product View displays. 3. Select (click) the icon representing the switch for which the channel wrap test will be performed. The Hardware View for the selected switch displays. 4. At the Hardware View, verify the location of the port to be tested. Click the port to be tested. The Port View displays. 5.
Repair Information 4. At the navigation control panel, select Swap Ports from the Maintenance menu. The Swap Ports dialog box displays (Figure 3–16). Figure 3–16: Swap Ports Dialog Box 5. At the First address and Second address fields, type the logical port addresses (in hexadecimal format) of the pair of ports to be swapped. The ports are automatically blocked during the procedure. Select the Unblock after swap check boxes to unblock the ports when the procedure completes. 6. Click Next.
Repair Information Perform the maintenance data collection procedure after a firmware fault is corrected or a failed FRU is replaced to capture the data for analysis by third-level support personnel. Maintenance data includes the dump file, hardware log, audit log, and an engineering log viewable only by support personnel. To collect maintenance data: 1. At the HAFM server, open the HAFM application. The Product View displays. 2.
Repair Information Figure 3–18: Data Collection Dialog Box 7. Click Close to close the dialog box. 8. Remove the Zip disk with the newly-collected maintenance data from the HAFM server Zip drive. Return the Zip disk to Hewlett Packard for failure analysis. 9. To ensure the QuikSync backup application operates normally, replace the original backup disk in the HAFM server Zip drive.
Repair Information A B Figure 3–19: Clean Fiber-Optic Components 3. Gently wipe the end-face and other surfaces of the connector with an alcohol pad as shown in part B of Figure 3–19. Ensure the pad makes full contact with the surface to be cleaned. Wait approximately five seconds for surfaces to dry. 4. Repeat step 2 and step 3 of this procedure (second cleaning). 5. Repeat step 2 and step 3 of this procedure again (third cleaning), then reconnect the fiber-optic cable to the port.
Repair Information b. The amber system error (ERR) LED on the switch front panel blinks momentarily while the switch is tested. c. The green LEDs associated with the Ethernet port blink momentarily while the port is tested. d. The green and amber LEDs associated with the ports blink momentarily while the ports are tested. 4. After successful POST completion, the green power (PWR) LED remains illuminated and all other LEDs extinguish. 5.
Repair Information • Reset the Ethernet local area network (LAN) interface, causing the connection to the HAFM server to drop momentarily until the connection automatically recovers. • Automatically enable changes to an active zone configuration. • Keep all configured fabric logins, name server registrations, and operating parameters intact. • Automatically set the switch online. The blocked state of each Fibre Channel port remains intact.
Repair Information 4. Click Yes to IPL the switch. During the IPL, the switch-to-HAFM server Ethernet link drops momentarily and the following occur at the product manager application: — As the network connection drops, the Status table turns yellow, the Status field displays No Link, and the State field displays a reason message. — The alert panel at the bottom of the navigation control panel displays a grey square, indicating switch status is unknown.
Repair Information 3. At the navigation control panel, select Set Online State from the Maintenance menu. If the switch is offline, the Set Online State dialog box displays, indicating the state is OFFLINE. 4. Click Set Online. A Warning dialog box displays, indicating the switch is to be set online. 5. Click OK. As the switch comes online, inspect the product manager application. The State field of the Status table displays Online. Set Offline State To set the switch offline: 1.
Repair Information Block and Unblock Ports This section describes procedures to block or unblock the switch ports. When a port is blocked, the port is automatically set offline. When a port is unblocked, the port is automatically set online. NOTE: When a port is blocked, the operation of an attached Fibre Channel device is disrupted. Do not block a port unless directed to do so by a procedural step or the next level of support. Block a Port To block a port: 1.
Repair Information 2. Select the icon representing the switch with the port to be unblocked. The Hardware View for the selected switch displays. 3. Move the pointer over the port and right-click the mouse to open a list of menus options. 4. Select Block Port. Note the check mark in the box adjacent to the menu item, indicating the port is blocked. The Unblock Port n dialog box displays (n is the port number). 5. Click OK.
Repair Information 1. At the HAFM server, open the HAFM application. The Product View displays. 2. Select the icon representing the switch to be inspected for firmware version. The Hardware View for the selected switch displays. 3. At the navigation control panel, select Firmware Library from the Maintenance menu. The Firmware Library dialog box displays. 4. The firmware version displays at the lower left corner of the dialog box in XX.YY.
Repair Information b. Follow links to HAFM software. c. Click the edge switch 2/16 Firmware Version XX.YY.ZZ entry, where XX.YY.ZZ is the desired version. The Windows Save As dialog box appears. d. Ensure the correct directory path is specified at the Save in field and the correct file is specified in the File name field. Click Save. The new firmware version is downloaded and saved to the HAFM server or PC hard drive. e.
Repair Information 5. Click New. The New Firmware Version dialog box displays. 6. Select the desired firmware version file (downloaded in step 1) from the HAFM server CD-ROM or hard drive. Ensure the correct directory path and filename appear in the File name field and click Save. The New Firmware Description dialog box displays. 7. Enter a description (up to 24 characters) for the new firmware version and click OK.
Repair Information 10. To send the firmware version to a switch, refer to "Download a Firmware Version to a Switch" on page 3-45. Modify a Firmware Version Description To modify the description of a switch firmware version in the library stored on the HAFM server hard drive: 1. At the HAFM server, open the HAFM application. The Product View displays. 2. Select the icon representing the switch for which a firmware version is to be modified. The Hardware View for the selected switch displays. 3.
Repair Information Delete a Firmware Version To delete an switch firmware version from the library stored on the HAFM server hard drive: 1. At the HAFM server, open the HAFM application. The Product View displays. 2. Select the icon representing the switch from which the firmware version is to be deleted. The Hardware View for the selected switch displays. 3. At the navigation control panel, select Firmware Library from the Maintenance menu. The Firmware Library dialog box displays. 4.
Repair Information To download a firmware version to a switch: 1. Notify the customer that a firmware version is to be downloaded to the switch. The switch resets during the firmware download, causing Fibre Channel links to momentarily drop and attached devices to log out and log back in. Data frames lost during switch reset must be retransmitted. 2. At the HAFM server, open the HAFM application. The Product View displays. 3. Before downloading firmware version XX.YY.ZZ to a switch, ensure version XX.YY.
Repair Information If a problem occurs and a corresponding message displays, go to "MAP 0000: Start MAP" on page 2-7 to isolate the problem. If no error occurs, the Send Firmware confirmation box displays. 8. Click Yes. The Send Firmware dialog box displays. As the download begins, a Sending Files message displays at the top of the dialog box. This message remains for a few moments as a progress bar travels across the dialog box to show percent completion of the download.
Repair Information 10. Click Close to close the Firmware Library dialog box and return to the Hardware View. Manage Configuration Data The product manager application provides maintenance options to back up, restore, or reset the configuration file stored in nonvolatile random-access memory (NV-RAM) on the switch CTP card. Configuration data in the file include: • Identification data (switch name, description, and location).
Repair Information 4. Click Backup. When the backup process finishes, the Backup Complete dialog box displays. 5. Click OK to close the dialog box and return to the Hardware View. Restore the Configuration To restore the switch configuration file from the HAFM server: 1. Notify the customer that the switch is to be set offline. Ensure the customer’s system administrator quiesces Fibre Channel frame traffic through the switch and sets attached devices offline. 2.
Repair Information 7. Click Yes. When the restore process finishes, the Restore Complete dialog box displays. 8. Click OK to close the dialog box and return to the Hardware View. Reset Configuration Data NOTE: This procedure resets the switch IP address to the default of 10.1.1.10 and may disrupt server-to-switch communication. To reset the switch data to the factory default settings: 1. Notify the customer the switch is to be set offline.
Repair Information Install or Upgrade Software This section describes the procedure to install or upgrade the HAFM application to the HAFM server. The HAFM application includes the switch product manager and HAFM services applications. The HAFM application shipped with the switch is provided on the HAFM Applications CD-ROM. Subsequent software versions for upgrading the switch are provided to customers through the HAFM Applications CD-ROM or through HP’s Internet home page.
Repair Information f. Select Save this program to disk and click OK. g. Ensure the correct directory path (c:\HafmData) is specified at the Save as dialog box, and the correct file is specified in the File name field. Click Save. The new software version executable file is downloaded and saved to the HAFM server or PC hard drive. h. If the executable file was downloaded to a PC (not the HAFM server), transfer the firmware version file to the HAFM server by diskette or other electronic means. i.
Repair Information 9. Follow the online instructions for the InstallAnywhere program. Click Next, Install, or Done as appropriate. 10. Power off and reboot the HAFM server PC. a. Simultaneously press Ctrl, Alt, and Delete to display the Windows Logon Information dialog box. b. Type a user name and password and click OK. The Windows desktop displays. NOTE: If required, obtain the user name and password from the customer or next level of support. 11. The HAFM application automatically opens.
4 Invisible Body4 FRU Removal and Replacement This chapter describes the removal and replacement procedures (RRPs) for the hp StorageWorks edge switch 2/16 (edge switch 2/16) field-replaceable units (FRUs). Do not remove a FRU until a failure is isolated to that FRU. If fault isolation was not performed, see MAP 0000: Start MAP on page 2–7. Remove and Replace FRUs This section describes procedures to remove and replace (RRPJ) concurrent switch FRUs.
FRU Removal and Replacement Procedural Notes Note the following: 1. Read the removal and replacement procedures (RRPs) for that FRU before removing the FRU. 2. Follow all WARNING and CAUTION statements and statements in the preface of this manual. 3. After completing a FRU replacement, clear the event code reporting the failure and the event code reporting the recovery from the switch Event Log (at the HAFM server).
FRU Removal and Replacement 6. Remove a non-IBM SFP from the chassis: a. Simultaneously squeeze the metal latches on the sides of the SFP to disengage the SFP from the port receptacle. b. Pull the SFP out of the chassis. 7. At the HAFM server’s Hardware View, select Event Log option from the Logs icon. The Event Log displays. Ensure the following event code appears in the log: — 510 - SFP hot-insertion initiated. Replacement To install an SFP in a switch port: 1.
FRU Removal and Replacement d. Verify that the amber LED adjacent to the port is extinguished. 6. At the HAFM server’s Hardware View, select the Event Log option from the Logs icon. The Event Log displays. Ensure the following event code appears in the log: — 513 - SFP hot-removal completed. If an event code 513 does not appear in the log, go to "MAP 0000: Start MAP" on page 2-7 to isolate the problem. 7. At the HAFM server’s Hardware View: a.
FRU Removal and Replacement 2. Turn off the power switch on the power supply. 3. Disconnect the AC power cord from the power supply. 4. Rotate the power lockout lever to the right to expose the black plastic latch lever. 5. Pull the latch lever down to the horizontal position. The power supply will disengage and back out about 1/4 inch when the lever is horizontal. 6. Use the latch lever to pull the power supply out of the chassis. Support the power supply as it exits the chassis.
FRU Removal and Replacement 9. Inspect the power supply to ensure that the green LED is illuminated. If the green LED is extinguished, go to "MAP 0000: Start MAP" on page 2-7 to isolate the problem. 10. At the HAFM server’s Hardware View, select the Event Log option from the Logs icon. The Event Log displays. Ensure the following event codes appear in the log: — 203 - Power supply AC voltage recovery. — 204 - Power supply DC voltage recovery. 11.
FRU Removal and Replacement Replacement To replace a cooling fan: 1. Remove the replacement cooling fan FRU from its shipping container. 2. Inspect the rear of the fan for bent or broken connector pins. If any pins are damaged, obtain a new fan. 3. Position the fan FRU with its retaining screw at the upper right corner (the fan cannot be inserted in any other position). 4. Push the fan FRU into the chassis to engage the connector pins until the fan faceplate is flush with the chassis. 5.
RRP: CTP Card - Switch Replacement Some event codes indicate a CTP card failure, as do some diagnostic paths through MAPs. The CTP card is not a FRU, and cannot be replaced. CTP card failure requires replacement of the entire switch. If the failed switch provides a critical singular link in the fabric, and that link is still operating, it may be necessary to schedule down-time for this replacement.
FRU Removal and Replacement — Connect the switch to the LAN. — Configure the switch for the HAFM application: 1. Right click in a blank area of the HAFM product view and select new. 2. Type the IP address of the switch in the new product dialog box. 3. Select the correct product type from the product type field and click OK. A new icon will display on the product view. — Configure the switch identification: 1. Click on the new icon to open the hardware view and click the configure icon. 2.
FRU Removal and Replacement 2. Verify that the active zoneset is the same active zoneset that is running on the fabric, and that the default zone is disabled. • Add the switch to the fabric: — Connect the fibre-optic cables to the switch ports. — Set the switch online. — Verify that the switch successfully joins the fabric.
5 Illustrated Parts Breakdown This chapter provides an illustrated parts breakdown for the hp StorageWorks edge switch 2/16 field-replaceable units (FRUs). Exploded-view assembly drawings are provided for: • Front-accessible FRUs. • Rear-accessible FRUs. • Miscellaneous parts. Exploded-view illustrations portray the switch disassembly sequence. Illustrated FRUs are numerically keyed to associated tabular parts lists. The parts lists also include part numbers, descriptions, and quantities.
Illustrated Parts Breakdown Table 5–1: Front-Accessible FRU Parts List Ref. Part Number Description Qty. 292007-001 Base assembly, edge switch 2/16, without optics Reference 1 292003-001 Transceiver, optical, shortwave laser, 2.125 Gbps, 850 nm, LC (2 to 500 meters) 0 to 16 1 292004-001 Transceiver, optical, longwave laser, 2.125 Gbps, 1300 nm, LC (up to 10 km) 0 to 16 1 292004-001 Transceiver, optical, longwave laser, 2.
Illustrated Parts Breakdown 1 3 2 3 Figure 5–2: Rear-Accessible FRUs Table 5–2: Rear-Accessible FRU Parts List Ref. Part Number Description Qty. 1 292007-001 Base assembly, edge switch 2/16, without optics Reference 2 292012-001 Power supply assembly (includes one cooling fan, P/N 292010-001) 2 3 292010-001 Fan, cooling 4 Miscellaneous Parts Table 5–3 is a list of miscellaneous parts. Table 5–3: Miscellaneous Parts Part Ref.
Table 5–3: Miscellaneous Parts (Continued) Part Ref. Number Description Ref 254139-001 Power cord, AC Adapter/Jumper, 2.
Invisible Body TagA Messages This appendix lists information and error messages that appear in pop-up message boxes at the hp StorageWorks ha-fabric manager (HAFM) application and hp StorageWorks edge switch 2/16 product manager applications. The first section of the appendix lists HAFM application messages. The second section lists product manager messages. The text of each message is followed by a description and recommended course of action.
Messages A–2 Message Description Action An HAFM application session is already active from this workstation. Only one instance of the HAFM application is allowed to be open per remote workstation. Close all but one of the HAFM application sessions. Are you sure you want to delete this network address? The currentlyselected network address will be deleted. Click Yes to delete or No to cancel.
Messages Message Description Action Cannot connect to HAFM server. The HAFM application at a remote workstation could not connect to the HAFM server. Verify the HAFM server internet protocol (IP) address is valid. Cannot delete product. The selected product cannot be deleted. Verify the HAFM server-to-product link is up. • If the link is up, the HAFM server may be busy. • Another product manager instance may be open. • The user may not have permission to delete the product. Cannot display route.
Messages Message A–4 Description Action Cannot modify a zone with an invalid name. Rename zone and try again. A zone must have a valid name to be modified. Assign a valid name to the zone, then click Modify. Cannot modify product. The selected product cannot be modified. Verify the HAFM server-to-product link is up. • If the link is up, the HAFM server may be busy. • Another product manager instance may be open. • The user may not have permission to modify the product. Cannot perform operation.
Messages Message Description Action Connection to HAFM server lost. Click OK to exit application. The HAFM application at a remote workstation lost the network connection to the HAFM server. Start the HAFM application to connect to the HAFM server. Could not export log to file. A log file input/output (I/O) error occurred and the file could not be saved to the specified destination. The disk may be full or write protected. If the disk is full, use another disk.
Messages Message A–6 Description Action Duplicate zone in zone set configuration. More than one instance of a zone is defined in a zone set. Delete one of the duplicate zones from the zone set. Duplicate zone member in zone configuration. More than one instance of a zone member is defined in a zone. Delete one of the duplicate zone members from the zone. Error connecting to switch. While viewing routes, the HAFM server was unable to connect to the switch.
Messages Message Description Action Error removing zone or zone member. The HAFM application encountered an internal error. Try the operation again. If the problem persists, contact the next level of support. Error transferring files < message >. An error occurred while transferring files from the PC hard drive to the HAFM application. The message varies, depending on the problem. Try the file transfer operation again. If the problem persists, contact the next level of support.
Messages Message A–8 Description Action Invalid name. One of the following invalid names was used: CON, AUX, COM1, COM2, COM3, COM4, COM5, COM6, COM7, COM8, COM9, LPT1, LPT2, LPT3, LPT4, LPT5, LPT6, LPT7, LPT8, LPT9, NUL, or PRN. Select a valid name and retry the operation. Invalid network address. The IP address specified for the product is unknown to the domain name server (invalid). Verify and enter a valid product IP address. Invalid product selection.
Messages Message Description Action Invalid World-Wide Name. The specified world-wide name format is invalid. The valid format is eight two-digit hexadecimal numbers separated by colons (xx:xx:xx:xx:xx:xx:x x:xx). Enter a world-wide name using the correct format. Invalid zone in zone set. The defined zone no longer exists and is invalid. Delete the invalid zone from the zone set. Management session is already active from this workstation.
Messages Message A–10 Description Action No user selected. A user was not selected when the command was attempted. Select a user and try again. No zone member selected. A zoning operation was attempted without a zone member selected. Select a zone member and try the operation again. No zone selected. A zoning operation was attempted without a zone selected. Select a zone and try the operation again. No zone selected or zone no longer exists.
Messages Message Description Action Password and confirmation don’t match. Entries in the password field and confirmation password field do not match. The entries are case sensitive and must be the same. Enter the password and confirmation password again. Product manager instance is currently open. A product cannot be deleted while an instance of the product manager application is open. Close the product manager application, then delete the product. Remote session support has been disabled.
Messages Message A–12 Description Action Routing is not supported by the switch. This switch or director does not support the Show Routes feature. Select a different switch or director to show the route. HAFM error . The HAFM application encountered an internal error (1 through 8 inclusive) and cannot continue operation. Contact the next level of support to report the problem. HAFM server is shutting down. Connection will be terminated.
Messages Message Description Action SNMP trap address not defined. If an SNMP community name is defined, a corresponding SNMP trap recipient address must also be defined. Enter a corresponding SNMP trap recipient address. Switch is not managed by HAFM. The selected switch or director is not managed by the HAFM application. Select a different switch or director. The Administrator user cannot be deleted. The administrator user is permanent and cannot be deleted from the Configure Users dialog box.
Messages A–14 Message Description Action The maximum number of open products has already been reached. The maximum number of open products allowed was reached. Close a product manager session (existing open product) before opening a new session. The maximum number of products has already been configured. The number of managed Hewlett Packard products (48) that can be defined to the HAFM application was reached. Delete an existing product before adding a new product.
Messages Message Description Action The maximum number of HAFM server network addresses has already been configured. The number of HAFM server IP addresses that can be defined to the HAFM application was reached. Delete an existing IP address before adding a new address. The maximum number of users has already been configured. The number of users (16) that can be defined to the HAFM application was reached. Delete an existing user before adding a new user.
Messages A–16 Message Description Action The HAFM server is busy processing a request from another product manager. The HAFM server PC is processing a request from another instance of a product manager application, and cannot perform the requested operation. Wait until the process is completes, then perform the operation again. The software version on this HAFM server is not compatible with the version on the remote HAFM server.
Messages Message Description Action You do not have a compatible version of the HAFM server software. In order for the HAFM application to function properly, a compatible version must be installed on the client machine. Click OK to install a compatible version. The HAFM application version running on the HAFM server differs from the version running on the remote workstation (client). A compatible version must be downloaded from the HAFM server.
Messages Message Description Action Zones configured with port numbers are ignored in Open Fabric Mode. While in Open Fabric mode, zones configured using port numbers are enforced through world-wide names. Informational message only no action is required. Zoning by port number is ignored in Open Fabric Mode. While in Open Fabric mode, zones configured using port numbers are enforced through world-wide names. Informational message only no action is required. Zoning name already exists.
Messages Message Description Another product manager is currently performing a firmware install. Only one instance of the product manager application can install a firmware version to the switch or director at a time. Wait for the firmware installation process to complete and try the operation again. Are you sure you want to delete firmware version? This message requests confirmation to delete a firmware version from the HAFM server’s firmware library.
Messages Message A–20 Description Action Cannot retrieve director date and time. The switch or director date and time cannot be retrieved by the product manager application because the Ethernet link is down or busy. Retry the operation later. If the condition persists, contact the next level of support. Cannot retrieve director state. The switch or director state cannot be retrieved by the product manager application because the Ethernet link is down or busy. Retry the operation later.
Messages Message Description Cannot run diagnostics on a port that is failed. Port diagnostics (loopback tests) cannot be performed on a port that has failed any previous diagnostic (power-on diagnostic, online diagnostic, or loopback test). The amber LED associated with the port illuminates to indicate the failed state. Reset the port and perform diagnostics again. Cannot run diagnostics on a port that is not installed.
Messages Message A–22 Description Action Cannot save SNMP configuration. The switch or director SNMP configuration cannot be saved at the product manager application because the Ethernet link is down or busy. Retry the operation later. If the condition persists, contact the next level of support. Cannot set director date and time. The switch or director date and time cannot be set at the product manager application because the Ethernet link is down or busy. Retry the operation later.
Messages Message Description Action Cannot start port diagnostics. Port diagnostics cannot be started at the product manager application because the Ethernet link is down or busy. Retry the operation later. If the condition persists, contact the next level of support. Click OK to remove all contents from log. This action deletes all contents from the selected log. Click OK to delete the log contents or Cancel to cancel the operation. Connection to HAFM server lost. Click OK to exit application.
Messages Message A–24 Description Action Could not stop port diagnostics. Port diagnostics could not be stopped by the product manager application because the Ethernet link is down or busy, or because the switch or director is busy. Retry the operation later. If the condition persists, contact the next level of support. Could not write firmware to flash. A firmware version could not be written from the HAFM server to FLASH memory on the Director’s CTP2 card. Retry the operation again.
Messages Message Description Action Do you want to continue with IPL? This message requests confirmation to initial program load (IPL) the switch or director. Click OK to IPL the switch or director or No to cancel the operation. Duplicate Community names require identical write authorizations. Duplicate community names are entered at the Configure SNMP dialog box, and have different write authorizations. Delete the duplicate community name or make the write authorizations consistent.
Messages A–26 Message Description Action Error transferring files < message >. An error occurred while transferring files from the PC hard drive to the product manager application. The message varies, depending on the problem. Try the file transfer operation again. If the problem persists, contact the next level of support. Field cannot be blank. The data field requires an entry and cannot be left blank. Enter appropriate information in the data field. File transfer aborted.
Messages Message Description Action Invalid character in field. An invalid character was entered in the data field. Remove invalid characters from the entry. Invalid firmware file. The file selected for firmware download is not a firmware version file. Select the correct firmware version file and retry the operation. Invalid network address. The IP address specified for the product is unknown to the domain name server (invalid). Verify and enter a valid product IP address. Invalid port number.
Messages Message A–28 Description Action Invalid value for BB_Credit. At the Configure Operating Parameters dialog box, the buffer-to-buffer credit (BB_Credit) value must be an integer from 1 through 60 inclusive. Verify and enter a valid number. Invalid value for day (1 - 31). At the Configure Date and Time dialog box, the DD value (day) must be an integer from 1 through 31 inclusive. Verify and enter a valid date. Invalid value for E_D_TOV.
Messages Message Description Action Invalid value for month (1 - 12). At the Configure Date and Time dialog box, the MM value (month) must be an integer from 1 through 12 inclusive. Verify and enter a valid date. Invalid value for R_A_TOV. At the Configure Operating Parameters dialog box, the resource allocation time-out value (R_A_TOV) must be an integer from 10 through 1200 inclusive. Verify and enter a valid number. Invalid value for second (0 - 59).
Messages Message A–30 Description Action Link dropped. The HAFM server-to-switch or director Ethernet link was dropped. Retry the operation. If the condition persists, contact the next level of support. Log is currently in use. Access to the log is denied because the log was opened by another instance of the product manager application. Retry the operation later. If the condition persists, contact the next level of support. Maximum number of versions already installed.
Messages Message Description Action Performing this action will overwrite the date/time on the director. Warning that occurs when configuring the date and time through the Configure Date and Time dialog box, that the new time or date will overwrite the existing time or date set for the switch or director. Verify that you want to overwrite the current date or time. Performing this operation will change the current state to Offline.
Messages A–32 Message Description Action Send firmware failed. A firmware download operation failed. Retry the firmware download operation. If the problem persists, contact the next level of support. SNMP trap address not defined. If an SNMP community name is defined, a corresponding SNMP trap recipient address must also be defined. Enter a corresponding SNMP trap recipient address. Start diagnostics failed. The test is currently running.
Messages Message Description Action The data collection process has been aborted. The user aborted the data collection procedure. Verify the data collection procedure is to be aborted, then click OK to continue. The director did not accept the request. The switch or director cannot perform the requested action. Retry the operation. If the condition persists, contact the next level of support. The director did not respond in the time allowed.
Messages Message A–34 Description Action The link to the director is not available. The Ethernet connection between the HAFM server and the switch or director is down or unavailable. Establish and verify the network connection. The HAFM server is busy processing a request from another product manager. The HAFM server PC is processing a request from another instance of a product manager application, and cannot perform the requested operation.
B Event Codes This appendix lists all three-digit hp StorageWorks edge switch 2/16 event codes and provides detailed information about each code. Event codes are listed in numerical order and in tabular format. An event is an occurrence (state change, problem detection, or problem correction) that requires user attention or that should be reported to a system administrator or service representative.
Event Codes — 3 - major. — 4 - severe (not operational). B–2 • Explanation - a complete explanation of what caused the event. • Action - the recommended course of action (if any) to resolve the problem. • Event Data - supplementary event data (if any) that appears in the event log in hexadecimal format. • Distribution - check marks in associated fields indicate where the event code is reported (front panel, HAFM server, or host).
Event Codes System Events (000 through 199) Event Code: 001 Message: System power-down. Severity: Informational. Explanatio n: The switch was powered off or disconnected from the facility AC power source. The event code is distributed the next time the switch powers on, but the date and time of the code reflect the power-off time. Action: No action required. Event Data: No supplementary data included with the event.
Event Codes Event Code: 021 Message: Name Server database invalid. Severity: Minor. Explanatio n: Following an IML or firmware download, the Name Server database failed its CRC validation. All Fabric Services databases are initialized to an empty, state resulting in an implicit Fabric logout of all attached devices. Action: Perform the data collection procedure and return the Zip disk to Hewlett Packard support personnel. Event Data: No supplementary data included with this event.
Event Codes Event Code: 051 Message: Management Server database invalid. Severity: Minor. Explanatio n: Following an IML, or firmware download, the Management Server database failed its CRC validation. All Management Services databases are initialized to an empty state, resulting in an implicit logout of all devices logged in to the Management Server. Action: Perform the data collection procedure and return the Zip disk to Hewlett Packard support personnel.
Event Codes Event Code: 061 Message: Fabric Controller database invalid. Severity: Minor. Explanatio n: Following an IML, or firmware download, the Fabric Controller database failed its CRC validation. All Fabric Controller databases are initialized to an empty state, resulting in a momentary loss of interswitch communication capability. Action: Perform the data collection procedure and return the Zip disk to Hewlett Packard support personnel.
Event Codes Event Code: 070 Message: E_Port is segmented. Severity: Informational. Explanatio n: A switch E_Port recognized an incompatibility with an attached fabric element (director or switch), preventing the switch from participating in the fabric. A segmented port does not transmit Class 2 or Class 3 traffic (data from attached devices), but transmits Class F traffic (management and control data from the attached director or switch). Refer to the event data for the segmentation reason.
Event Codes Event Code: 070 (continued) Distributio n: Switch EWS Event Log HAFM Server System Error LED 4 Event Log E-Mail Host Call-Hom e Sense Info Link Incident 4 Event Code: 071 Message: Switch is isolated. Severity: Informational. Explanatio n: The switch is isolated from other fabric elements (directors or switches). This event code is accompanied by one or more 070 event codes. Refer to the event data for the segmentation reason.
Event Codes Event Code: 071 (continued) Event Data (continued ): 4 = Build fabric protocol error. A protocol error was detected during incorporation of the switch into the fabric. Disconnect the E_Port link, reconnect the link, and IPL the switch. If the condition persists, perform the data collection procedure and return the Zip disk to Hewlett Packard support personnel. 5 = No principal switch. No director or switch in the fabric can become the principal switch.
Event Codes Distributio n: Switch EWS Event Log 4 B–10 HAFM Server System Error LED Event Log E-Mail Host Call-Hom e Sense Info Link Incident 4 edge switch 2/16 service manual
Event Codes Event Code: 080 Message: Unauthorized world-wide name. Severity: Informational. Explanatio n: The world-wide name of the device or switch plugged in the indicated port is not authorized for that port. Action: Change the port binding definition or plug the correct device or switch into this port. Event Data: Byte 0 = failing port number.
Event Codes Power Supply Events (200 through 299) Event Code: 200 Message: Power supply AC voltage failure. Severity: Major. Explanatio n: Alternating current (AC) input to the indicated power supply is disconnected or AC circuitry in the power supply failed. The second power supply assumes the full operating load for the switch. Action: Ensure the power supply is connected to facility AC power, and verify operation of the facility power source.
Event Codes Event Code: 202 Message: Power supply thermal failure. Severity: Major. Explanatio n: The thermal sensor associated with a power supply indicates an overheat condition that shut down the power supply. The second power supply assumes the full operating load for the switch. Action: Replace the failed power supply. Perform the data collection procedure and return the Zip disk and failed power supply to Hewlett Packard support personnel.
Event Codes Event Code: 204 Message: Power supply DC voltage recovery. Severity: Informational. Explanatio n: DC voltage recovered for the power supply. Both power supplies adjust to share operating load for the switch. Action: No action required. Event Data: No supplementary data included with the event. Distributio n: Switch EWS Event Log HAFM Server System Error LED 4 Event Log E-Mail Host Call-Hom e Sense Info Link Incident 4 Event Code: 206 Message: Power supply removed.
Event Codes Event Code: 207 Message: Power supply installed. Severity: Informational. Explanatio n: A redundant power supply was installed with the switch powered on and operational. Both power supplies adjust to share operating load for the switch. Action: No action required. Event Data: No supplementary data included with the event.
Event Codes Fan Module Events (300 through 399) Event Code: 300 Message: Cooling fan propeller failed. Severity: Major. Explanatio n: One cooling fan (out of six) failed or is rotating at insufficient angular velocity. The remaining fans are operational. The amber LED illuminates at the rear of the failed fan. Action: Replace the indicated fan module. Event Data: The first byte of event data (byte 0) specifies the failed fan number.
Event Codes Event Code: 302 Message: Cooling fan propeller failed. Severity: Major. Explanatio n: Three cooling fans (out of six) failed or are rotating at insufficient angular velocity. The remaining fan is operational. The amber LED illuminates at the rear of the failed fans. Action: Replace the indicated fan modules. Event Data: The first byte of event data (byte 0) specifies the failed fan numbers.
Event Codes Event Code: 304 Message: Cooling fan propeller failed. Severity: Major. Explanatio n: Five cooling fans (out of six) failed or are rotating at insufficient angular velocity. The remaining fan is operational. The amber LED illuminates at the rear of the failed fans. Action: Replace the indicated fan modules. Event Data: The first byte of event data (byte 0) specifies the failed fan numbers.
Event Codes Event Code: 310 Message: Cooling fan propeller recovered. Severity: Informational. Explanatio n: One cooling fan (out of six) recovered or the associated fan module was replaced. All fans are operational. Action: No action required. Event Data: The first byte of event data (byte 0) specifies the recovered fan number.
Event Codes Event Code: 312 Message: Cooling fan propeller recovered. Severity: Informational. Explanatio n: Three cooling fans (out of six) recovered or the associated fan modules were replaced. All fans are operational. Action: No action required. Event Data: The first byte of event data (byte 0) specifies the recovered fan numbers.
Event Codes Event Code: 313 Message: Cooling fan propeller recovered. Severity: Informational. Explanatio n: Five cooling fans (out of six) recovered or the associated fan modules were replaced. All fans are operational. Action: No action required. Event Data: The first byte of event data (byte 0) specifies the recovered fan numbers.
Event Codes CTP2 Card Events (400 through 499) NOTE: The term CTP card refers to the main circuit board of the Edge Switch 2/16, not to a separate card that contains the CTP. The CTP is an integral part of the main circuit board. Event Code: 400 Message: Power-up diagnostics failure. Severity: Major. Explanatio n: Power-on self tests (POSTs) detected a faulty field-replaceable unit (FRU) as indicated by the event data. Action: Replace the failed FRU with a functional FRU.
Event Codes Distributio n: Switch EWS Event Log HAFM Server System Error LED 4 edge switch 2/16 service manual Event Log E-Mail Host Call-Hom e Sense Info Link Incident 4 B–23
Event Codes Event Code: 411 Message: Firmware fault. Severity: Major. Explanatio n: Firmware executing on the CTP card encountered an unexpected operating condition and dumped the operating state to FLASH memory for retrieval and analysis. The dump file is automatically transferred from the switch to the HAFM Server, where it is stored for retrieval through the data collection procedure. All Fibre Channel port connections reset after the fault and subsequent IPL.
Event Codes Event Data: Bytes 0 and 1 = ASCII pair indicating release level (30 31 indicates release 01). Byte 2 = ASCII value for a period (2E). Bytes 3 and 4 = ASCII pair indicating maintenance level (30 34 indicates maintenance release 04). Byte 5 = ASCII value for a period (2E). Bytes 6 and 7 = ASCII pair indicating interim release level (30 30 indicates interim release 00). Byte 8 = ASCII value for a period (2E).
Event Codes Event Code: 423 Message: CTP firmware download initiated. Severity: Informational. Explanatio n: The HAFM server initiated download of a new firmware version to the switch. Action: No action required. Event Data: No supplementary data included with this event. Distributio n: Switch EWS Event Log HAFM Server System Error LED 4 Event Log E-Mail Host Call-Hom e Sense Info Link Incident 4 Event Code: 430 Message: Excessive Ethernet transmit errors. Severity: Informational.
Event Codes Distributio n: Switch EWS Event Log HAFM Server System Error LED 4 Event Log E-Mail Host Call-Hom e Sense Info Link Incident 4 Event Code: 431 Message: Excessive Ethernet receive errors. Severity: Informational. Explanatio n: Receive error counters for the CTP card Ethernet adapter (sum of all counters) exceeded a threshold. This does not indicate a CTP failure; it indicates a problem with the Ethernet cable, hub, or device on the same Ethernet segment.
Event Codes Event Code: 432 Message: Ethernet adapter reset. Severity: Minor. Explanatio n: The CTP card Ethernet adapter was reset in response to an internally detected error. A card failure is not indicated. The switch-to-HAFM Server connection terminates, but automatically recovers after the reset. Action: Perform the data collection procedure and return the Zip disk to Hewlett Packard support personnel.
Event Codes Event Code: 440 Message: Embedded port hardware failed. Severity: Major. Explanatio n: The embedded port hardware detected a fatal CTP error. Action: Replace the failed switch. Perform the data collection procedure and return the Zip disk and faulty switch to Hewlett Packard support personnel. Event Data: Byte 0 = CTP2 slot position (00 or 01). Byte 1 = engineering reason code Bytes 4 through 7 = elapsed millisecond tick count.
Event Codes Event Code: 442 Message: Embedded port anomaly detected. Severity: Informational. Explanatio n: The CTP detected a deviation in the normal operating mode or status of the embedded port. Action: No action required. An additional event code is generated if this incident exceeds an error threshold or results in a port failure. Event Data: Byte 0 = port number. Byte 1 = engineering reason code.port. Bytes 4 through 7 = elapsed millisecond tick count.
Event Codes Event Code: 460 Message: Management request out of range. Severity: Informational Explanatio n: This event occurs when requests passed from the managing tool (generally HAFM) to the switch do not meet data boundary specifications. This event is most likely to be triggered if a user attempt to activate a zone set that is larger than the maximum defined zone set size. Action: The switch found request data from the management tool to be larger or smaller than expected.
Event Codes Port Events (500 through 599) NOTE: In the Edge Switch 2/16, ports are not included on separate assemblies (UPM cards), therefore are not FRUs. Ports are an integral part of the switch’s main circuit board. UPM card events apply to a single port as indicated by byte 13 of event data. Event Code: 502 Message: UPM card anomaly detected. Severity: Informational. Explanatio n: The CTP detected a deviation in the normal operating mode or status of the indicated port.
Event Codes Event Code: 507 Message: Loopback diagnostics port failure. Severity: Informational. Explanatio n: A loopback diagnostic test detected a Fibre Channel port failure. Action: No action required. An event code 506 is generated if this diagnostic failure results in a hard port failure. Event Data: Byte 0 = port number (00 through 63). Byte 1 = engineering reason code. Bytes 4 through 7 = elapsed millisecond tick count. Bytes 8 through 11 = reason code specific. Byte 12 = test type.
Event Codes Event Code: 508 Message: Fibre Channel port anomaly detected. Severity: Informational. Explanatio n: The CTP detected a deviation in the normal operating mode or status of the indicated Fibre Channel port. Action: No action required. An event code 506 is generated if this anomaly results in a hard port failure. Event Data: Byte 0 = port number (00 through 63). Byte 1 = anomaly reason code. Bytes 4 through 7 = elapsed millisecond tick count.
Event Codes Distributio n: Switch EWS Event Log HAFM Server System Error LED 4 Event Log E-Mail Host Call-Hom e Sense Info Link Incident 4 Event Code: 512 Message: SFP optical transceiver nonfatal error. Severity: Minor. Explanatio n: Switch firmware detected an SFP optical transceiver non-fatal error. Action: Replace the failed transceiver with a functional transceiver of the same type. Event Data: Byte 0 = port number (00 through 63). Byte 1 = engineering reason code.
Event Codes Distributio n: Switch EWS Event Log 4 B–36 HAFM Server System Error LED Event Log E-Mail Host Call-Hom e Sense Info Link Incident 4 edge switch 2/16 service manual
Event Codes Event Code: 514 Message: SFP optical transceiver failure. Severity: Major. Explanatio n: A SFP optical transceiver failed. The amber LED corresponding to the port illuminates to indicate the failure. Other ports remain operational if their LEDs are extinguished. Action: Replace the failed transceiver with a functional transceiver of the same type. Event Data: Byte 0 = port number (00 through 63). Byte 1 = engineering reason code. Bytes 4 through 7 = elapsed millisecond tick count.
Event Codes SBAR Events (600 through 699) NOTE: In the Edge Switch 2/16, the SBAR is not a separate assembly, therefore not a FRU. It is an integral part of the switch’s main circuit board. SBAR failure requires replacement of the entire switch. Event Code: 602 Message: SBAR assembly anomaly detected. Severity: Informational. Explanatio n: Switch operational firmware detected a deviation in the normal operating mode or operating status of the SBAR. Action: No action required.
Event Codes Thermal Events (800 through 899) Event Code: 810 Message: High temperature warning (CTP card thermal sensor). Severity: Major. Explanatio n: The thermal sensor associated with a CTP card indicates the warm temperature threshold was reached or exceeded. Action: Replace the failed switch. Perform the data collection procedure and return the Zip disk and faulty switch to Hewlett Packard support personnel. Event Data: No supplementary data included with this event.
Event Codes Event Code: 812 Message: CTP card shutdown due to thermal violation. Severity: Major. Explanatio n: A CTP failed and was powered off because of excessive heat. This event follows an indication that the hot temperature threshold was reached or exceeded (event code 811). Action: Replace the failed switch. Perform the data collection procedure and return the Zip disk and faulty switch to Hewlett Packard support personnel. Event Data: No supplementary data included with this event.
Glossary This glossary defines terms used in this manual or related to this product and is not a comprehensive glossary of computer terms. NUMERICS 8B/10B A data encoding scheme developed by IBM, translating byte-wide data to an encoded 10-bit format. 10BaseT An implementation of the Institute of Electrical and Electronics Engineers (IEEE) Ethernet standard on 24-gauge unshielded twisted-pair wiring, a baseband medium at 10 Mbps.
Glossary access time The amount of time, including seek time, latency, and controller time, necessary for a storage device to retrieve information. active configuration In S/390 mode, the director or switch configuration that is determined by the status of the connectivity attributes. active field-replaceable unit Active FRU. A FRU that is currently operating as the active, and not the backup FRU. See also backup field-replaceable unit. active FRU See active field-replaceable unit.
Glossary allowed connection In S/390 mode, in a director or switch, the attribute that when set, establishes dynamic connectivity capability. Contrast with blocked connection. See connectivity attribute. See also dynamic connectivity; unblocked connection. allowed port connection In S/390 mode, this attribute establishes dynamic connectivity capability. alternating current AC. Electric current that reverses direction at regular sinusoidal intervals (D). Contrast with direct current.
Glossary application-specific integrated circuit ASIC. An asynchronous transfer mode (ATM) local area network/ wide area network (LAN/WAN) circuit using cell relay transport technology. ASICs are designed for a specific application or purpose, such as implementing the lower-layer Fibre Channel protocol (FC-0). They are particularly suited to sending video and audio information, as well as text. ASICs differ from general-purpose devices such as memory chips or microprocessors.
Glossary B b See bit. B See byte. backbone Cable on which two or more stations or networks may be attached, typically used to link computer networks at one site with those at another. Smaller branch networks are sometimes called ribs. backplane The backplane provides direct current (DC) power distribution and connections for all logic cards. backup field-replaceable unit Backup FRU.
Glossary bezel A removable panel that covers empty drive bays and port cards. bidirectional In Fibre Channel protocol, the capability to simultaneously communicate at maximum speeds in both directions over a link. bit Abbreviated as b. (1) Binary digit, the smallest unit of data in computing, with a value of zero or one (D). (2) A bit is the basic data unit of all digital computers.
Glossary Bps Bytes per second. bridge (1) An attaching device that connects two local area network (LAN) segments to allow the transfer of information from one LAN segment to the other. A bridge can connect the LAN segments directly by network adapters and software in a single device, or can connect network adapters in two devices through software and use of a telecommunication link between the two adapters.
Glossary buffer-to-buffer credit BB_Credit. (1) The maximum number of receive buffers allocated to a transmitting node port (N_Port) or fabric port (F_Port). Credit represents the maximum number of outstanding frames that can be transmitted by that N_Port or F_Port without causing a buffer overrun condition at the receiver. (2) The maximum number of frames a port can transmit without receiving a receive ready signal from the receiving device.
Glossary channel (1) A system element that controls one channel path, and whose mode of operation depends on the type of hardware attached. Each channel controls an I/O interface between the channel control element and the attached control units (D). (2) Point-to-point link that transports data from one point to the other. (3) A connection or socket on the motherboard to controller card. A motherboard may have only one or two channels (primary and secondary).
Glossary community name (SNMP) A name that represents an simple network management protocol (SNMP) community that the agent software recognizes as a valid source for SNMP requests. A product recognizes a management station as a valid recipient for trap information when the station’s community names are configured. community profile Information that specifies which management objects are available to what management domain or simple network management protocol (SNMP) community name.
Glossary connectivity attribute In S/390 mode, the characteristic that determines port address status for the director or switch. See allowed connection; blocked connection; connectivity capability; connectivity control; dynamic connection; dynamic connectivity; unblocked connection. connectivity capability (1) The capability that allows attachment of a device to a system without requiring physical reconfiguration of either the device or the interconnections.
Glossary D database A collection of data with a given structure for accepting, storing, and providing on-demand data for multiple users. (T) data directory Critical information for all managed products (including directors and switches). Information stored here includes: • All configuration data • All log files • Call-home settings • Firmware library • Zoning library datagram Synonym for Class 3 Fibre Channel service. dB See decibel. dBm Decibels referenced to one milliwatt.
Glossary device (1) Mechanical, electrical, or electronic hardware with a specific purpose (D). See also managed product. (2) See node. diagnostics (1) The process of investigating the cause or nature of a problem in a product or system. (2) Procedures or tests used by computer users and service personnel to diagnose hardware or software problems (D). dialog box A pop-up window in the user interface with informational messages or fields to be modified or completed with desired options.
Glossary domain ID Domain identifier. A number that uniquely identifies a switch in a multiswitch fabric. A distinct domain ID is automatically allocated to each switch in the fabric by the principal switch. The preferred domain ID is the domain ID value that a switch requests from the principal switch. If the value has not been allocated to another switch in the fabric, it will be granted by the principal switch and will become the requesting switch’s active domain ID.
Glossary E EAF See enhanced availability feature. EDI See electronic data interchange. E_D_TOV See error-detect time-out value. EE-PROM See electronically erasable programmable read-only memory. HAFM Audit Log HAFM Audit Log. Log displayed though the HAFM application that provides a history of user actions performed at the HAFM server through the HAFM application. This information is useful for system administrators and users.
Glossary HAFM server HAFM server. A laptop shipped with the product for the purpose of running the HAFM application and HAFM Services applications. HAFM Session Log HAFM Session Log. Log displayed though the HAFM application that records a session (login and logout) history for the HAFM server, including the date and time, user name, and network address of each session. This information is useful for system administrators and users. See also HAFM Audit Log; HAFM Event Log; HAFM Product Status Log.
Glossary embedded web server interface The interface provides a graphical user interface (GUI) similar to the Product Manager application, and supports director or switch configuration, statistics monitoring, and basic operations. With director or switch firmware installed, administrators or operators with a browser-capable personal computer (PC) and an Internet connection can monitor and manage the director or switch through an embedded web server interface.
Glossary Ethernet A widely implemented local area network (LAN) protocol that uses a bus or star topology and serves as the basis for the Institute of Electrical and Electronics Engineers (IEEE) 802.3 standard, which specifies the physical and software layers. Ethernet hub A device used to connect the HAFM server and the directors it manages. event code A three-digit number that specifies the exact event that occurred.
Glossary F fabric Entity that interconnects node ports (N_Ports) and is capable of routing (switching) Fibre Channel frames, using the destination ID information in the Fibre Channel frame header accompanying the frames. A switch is the smallest entity that can function as a complete switched fabric topology. fabric element Any active director, switch, or node in a switched fabric. fabric login The process by which node ports (N_Ports) establish their operating parameters.
Glossary FC-0 The Fibre Channel layer that describes the physical link between two ports, including the transmission media, transmitter and receiver circuitry, and interfaces (D). This consists of a pair of either optical fiber or electrical cables (link media) along with transceiver circuitry which work together to convert a stream of bits at one end of the link to a stream of bits at the other end.
Glossary FC IP See Fibre Channel IP address. FCMGMT See Fibre Channel management framework integration. FC-PH See Fibre Channel physical and signaling interface. feature key A unique key to enable additional product features. This key is entered into the Configure Feature Key dialog box in the Product Manager application to activate optional hardware and software features. Upon purchasing a new feature, Hewlett Packard will provide the feature key to the customer.
Glossary Fibre Channel Association FCA. The FCA is a non-profit corporation consisting of over 150 members throughout the world. Its mission is to nurture and help develop the broadest market for Fibre Channel products through market development, education, standards monitoring, and fostering interoperability among members’ products. Fibre Channel fabric element FCFE. Any device linked to a fabric. Fibre Channel fabric element management information base FCFE-MIB.
Glossary Fibre Connection FICON. An IBM set of products and services introduced in 1999 that is based on the Fibre Channel Standard. FICON technology uses fiber-optic cables as the data transmission medium, and significantly improves I/O performance (including one Gbps bi-directional data transfer). FICON is designed to coexist with ESCON™ channels, and FICON-to-ESCON control unit connections are supported. FICON See Fibre Connection.
Glossary F_Port See fabric port. frame A variable-length packet of data that is transmitted in frame relay technology. FRU See field-replaceable unit. FTP See file transfer protocol. full-duplex The capability to transmit in two directions simultaneously. G gateway address (1) In transmission control protocol/Internet protocol (TCP/IP), a device that connects two systems that use the same or different protocols.
Glossary gigabyte GB. A unit of measure for data storage, equal to 1,073,741,824 bytes. Generally approximated as one billion bytes (D). gigahertz GHz. One billion cycles per second (Hertz) (D). G_Port See generic port. graphical user interface GUI. A visually oriented interface where the user interacts with representations of real-world objects displayed on the computer screen. Interactions with such objects produce actions that are intuitive to the user (D).
Glossary Hertz Hz. A unit of frequency equal to one cycle per second. heterogeneous fabric A fabric containing open-fabric-compliant products from various vendors. Contrast with homogeneous fabric. hexadecimal A numbering system with base of sixteen; valid numbers use the digits 0 through 9 and characters A through F, where A represents 10 and F represents 15 (D). high availability A performance feature characterized by hardware component redundancy and concurrent maintenance.
Glossary hub (1) In Fibre Channel protocol, a device that connects nodes into a logical loop by using a physical star topology. (2) In Ethernet, a device used to connect the HAFM server and the directors it manages. hyperlink A predefined link for jumping from one location to another, within the same computer or network site or even to a location at a completely different physical location. Commonly used on the world wide web for navigation, reference, and depth where published text will not suffice.
Glossary initial program load IPL. The process of initializing the device and causing the operating system to start. An IPL may be initiated through a menu option or a hardware button. initial program load configuration IPL configuration. In S/390 mode, information stored in a director or switch’s nonvolatile memory that contains default configurations. The director or switch loads the file for operation when powered on. Institute of Electrical and Electronics Engineers IEEE.
Glossary interswitch link ISL. Physical expansion port (E_Port) connection between two directors in a fabric. interswitch link hop ISL hop. See hop. IOPS Input/output operations per second. IP See Internet protocol. IP address See Internet protocol address. IPL See initial program load. IPL configuration See initial program load configuration. ISL See interswitch link. ISL hop Interswitch link hop. See hop. isolated E_Port Isolated expansion port. See segmented expansion port.
Glossary Jumper cable Optical cable that provides physical attachment between two devices or between a device and a distribution panel. Contrast with trunk cable. See also optical cable. K Kb See kilobit. KB See kilobyte. kilobit Kb. A unit of measure for data storage, equaling 1,024 bits, or two to the tenth power. Kilobits are generally approximated as being one thousand bits. kilobyte KB. A unit of measure for data storage, equaling 1,024 bytes, or two to the tenth power.
Glossary light-emitting diode LED. A semiconductor chip that emits visible or infrared light when electricity passes through it. LEDs are used on switch or director field-replaceable units (FRUs) and the front bezel to provide visual indications of hardware status or malfunctions. LIN See link incident. link Physical connection between two devices on a switched fabric. A link consists of two conductors, one used for sending and the other for receiving, thereby providing a duplex communication path.
Glossary logical port address In a director or switch, the address used to specify port connectivity parameters and to assign link addresses for the attached channels and control units. logical switch number LSN. A two-digit number used by the I/O configuration program (IOCP) to identify a director or switch (D). logical unit number LUN.
Glossary M MAC address See media access control address. main panel (1) The rightmost frame of the windows in HAFM applications. (2) The rightmost frame of the embedded web server interface window. See also navigation panel. maintenance analysis procedure MAP. A written or online set of procedures that guide maintenance personnel through step-by-step instructions for hardware fault isolation, repair, and verification (D).
Glossary MBps Megabytes per second. media access control address MAC address. Hardware address of a node (device) connected to a network. megabyte MB. A unit of measure for data storage, equal to 1,048,576 bytes. Generally approximated as one million bytes. memory A device or storage system capable of storing and retrieving data. menu A list of items displayed on a monitor from which a user can make a selection. menu bar The menu bar is located across the top of a monitor window.
Glossary multiswitch fabric Fibre Channel fabric created by linking more than one director or fabric switching device within a fabric. N name server (1) In TCP/IP, see domain name server. (2) In Fibre Channel protocol, a server that allows node ports (N_Ports) to register information about themselves. This information allows N_Ports to discover and learn about each other by sending queries to the name server.
Glossary network management The broad subject of managing computer networks. There exists a wide variety of software and hardware products that help network system administrators manage a network. Network management covers a wide area, including security, performance, and reliability. never principal The setting that prevents the product from becoming the principal switch for a fabric. NIC See network interface card.
Glossary O octet An 8-bit quantity, often called a byte or word. An octet can equal a byte as long as the byte equals eight bits. See also byte. OEM See original equipment manufacturer. offline Referring to data stored on a medium, such as tape or even paper, that is not available immediately to the user. offline diagnostics Diagnostics that only operate in stand alone mode. User operations cannot take place with offline diagnostics running. offline sequence OLS.
Glossary Open Systems Architecture OSI. A model that represents a network as a hierarchical structure of functional layers. Each layer provides a set of functions that can be accessed and used by the layer above. Layers are independent, in that implementation of a layer can be changed without affecting other layers (D). open systems management server OSMS. An optional feature that can be enabled on the director or switch through the Product Manager application.
Glossary ordered set In Fibre Channel protocol, four 10-bit characters (a combination of data and special characters) providing low-level link functions, such as frame demarcation and signaling between two ends of a link. It provides for initialization of the link after power-on and for some basic recovery functions. original equipment manufacturer OEM. A company that has a special relationship with computer producers. OEMs buy components and customize them for a particular application.
Glossary persistent binding A form of server-level access control that uses configuration information to bind a server to a specific Fibre Channel storage volume (or logical device), using a unit number. See also access control. personal computer PC. A portable computer that consists of a system unit, display, keyboard, mouse, one or more diskette drives, and internal fixed-disk storage (D).
Glossary principal switch In a multiswitch fabric, the switch that allocates domain IDs to itself and to all other switches in the fabric. There is always one principal switch in a fabric. If a switch is not connected to any other switches, it acts as its own principal switch. printed wiring assembly PWA. A thin board on which integrated circuits and other electronic components are placed and connected to each other via thin copper traces.
Glossary protective plug In a fiber-optic environment, a type of duplex connector (or cover) that provides physical protection (D). Contrast with loopback plug. protocol (1) Set of semantic and syntactic rules that determines the behavior of functional units in achieving communication. (2) In systems network architecture, the meanings of and sequencing rules for requests and responses for managing the network, transferring data, and synchronizing network component states.
Glossary read-only memory ROM. An information storage chip with permanent memory. Stored information cannot be changed or deleted except under special circumstances (D). Contrast with random access memory. redundancy Performance characteristic of a system or product whose integral components are backed up by identical components to which operations will automatically failover in the event of a component failure.
Glossary S S/390 mode The mode that is most useful when attaching to IBM S/390 Enterprise Servers. See also open systems mode; operating mode. SA/MVS™ See System Automation for Operating System/390. SAN See storage area network; system area network. SA OS/390™ See System Automation for Operating System/390. scalable Refers to how well a system can adapt to increased demands. For example, a scalable network system could start with just a few nodes but easily expands to thousands of nodes.
Glossary SFP transceivers See small form factor pluggable transceivers. shortwave Lasers or light-emitting diodes (LEDs) that emit light with wavelengths around 780 nm or 850 nm. When using multimode fiber (50 nm) shortwave lasers can be used with Fibre Channel links less than 500 m. To achieve longer lengths, single-mode fiber is required. The preferred fiber core size is 50 micron as this fiber has large bandwidth so that the distance is limited by the fiber attenuation. A 62.
Glossary singlemode optical fiber An optical fiber that allows one wavelength-dependent mode (light path) to propagate. Contrast with multimode optical fiber. small computer system interface SCSI. An interface standard that enables computers to communicate with peripherals connected to them. Commonly used in enterprise computing and in Apple Macintosh systems. Usually pronounced as “scuzzy.” The equivalent interface in most personal computers is enhanced integrated drive electronics (EIDE).
Glossary static random access memory SRAM. SRAM is microprocessor-cache random access memory. It is built internal to the microprocessor or on external chips. SRAM is fast, but relatively expensive (D). Contrast with dynamic random access memory. storage area network SAN. A high-performance data communications environment that interconnects computing and storage resources so that the resources can be effectively shared and consolidated. stored addresses In S/390 mode, a method for configuring addresses.
Glossary System Automation for Operating System/390 SA OS/390™. IBM licensed software that provides System/390 Parallel Sysplex™ management, automation capabilities, and integrated systems and network management. SA OS/390 manages host, remote processor, and I/O operations. SA OS/390 integrates the functions of Automated Operations Control for Multiple Virtual Storage (MVS™), ESCON™ Manager, and Target System Control Facility (D). system name See product name. system services processor SSP.
Glossary terabyte TB. One thousand (1,000) gigabytes; one terabyte of text on paper would consume 42,500 trees. At 12 characters per inch, 1 TB of data in a straight line would encircle the earth 56 times and stretch some 1.4 million miles equalling nearly three round trips from the earth to the moon. Threshold Alert Log Director or switch Threshold Alert Log. Log displayed through the Product Manager application that provides details of threshold alert notifications for an individual director or switch.
Glossary trap host Simple network management protocol (SNMP) management workstation that is configured to receive traps. trap recipient In simple network management protocol (SNMP), a network management station that receives messages through SNMP for specific events that occur on the arbitrated loop device. trunk cable Cable consisting of multiple fiber pairs that do not directly attach to an active device.
Glossary UNIX A popular multi-user, multitasking operating system originally designed to be a small, flexible system used exclusively by programmers. UNIX was one of the first operating systems to be written in a high-level programming language, namely C. This meant that it could be installed on virtually any computer for which a C compiler existed. Due to its portability, flexibility, and power, UNIX has become the leading operating system for workstations.
Glossary virtual storage VS. (1) Storage space that may be regarded as addressable main storage by the user of a computer system in which virtual addresses are mapped to real addresses. The size of virtual storage is limited by the addressing scheme of the computer system and by the amount of auxiliary storage available, not by the number of main storage locations.
Glossary wrap plug Synonym for loopback plug. wrap test A test that checks attachment or control unit circuitry, without checking the mechanism itself, by returning the output of the mechanism as input. A wrap test can transmit a specific character pattern through a system and compare the pattern received with the pattern transmitted (D).
Glossary Glossary–54 edge switch 2/16 service manual
Index 10/100 Mbps LAN connectors 1–12 A additional port function 2–67 alert symbols HAFM 1–22 Product Manager 1–26 alerts introduction 1–5 audit logs 3–6 B bandwidth of ports 1–1 beaconing introduction 1–6 blocking a port 3–39 C call home feature introduction 1–6 call-home notification reporting 1–42 CD-ROM drive 1–12 channel wrap test, procedure 3–29 circle, green meaning of 1–35 clock speed 1–12 configuration data backing up 3–48 managing 3–48 resetting 3–50 restoring 3–49 connectors and indicators 1–1
Index embedded web server 1–12 diagnostics 1–40 ESD repair procedures, caution 3–2 Ethernet hub 1–12 LAN, connector 1–19 ethernet LAN connectors 1–12 event codes CTP2 card events B–21 description B–1 fan module events B–15 power supply events B–11 system events B–3 thermal events B–36 event log 3–6 external loopback tests 3–28 F fabric logs 3–5 fabric manager messages A–1 fabric tree 1–36 Fabrics Tab zone sets view 3–17 fabrics view topology tab, illustration 1–36 view area 1–36 zone sets tab, illustratio
Index HAFM server remote workstation 1–3 HAFM Services description 1–38 event table 1–38 status line 1–39 hard drive 1–12 hardware log 3–7 Hardware View 1–24, 3–20 hardware view 1–27 displayed 1–27, 1–28 status conditions 1–27 status symbol function 1–28 using 1–27 I illustrated parts breakdown 5–1 IML button 1–17, 1–19 IML procedure 3–35 inactive port 2–67 inband management access methods 1–4 Intel Pentium processor 1–12 internal loopback tests 3–26 IP address default 2–1, 3–2 IPL procedure 3–35 L LAN c
Index MAPs 2–1 collecting data 3–31 event codes B–1 MAP 0000-Start Map 2–7 MAP 0100-Power Distribution Analysis 2–26 MAP 0200-POST, Reset or IPL Failure Analysis 2–32 MAP 0300-Console Application Problem Determination 2–33 MAP 0400-Loss of Console Communication 2–39 MAP 0500-Fan and CTP Card Failure Analysis 2–58 MAP 0600-Port Failure and Link Incident Analysis 2–63 MAP 0700-Fabric, ISL, and Segmented Port Problem Determination 2–79 MAP 0800-Console PC Problem Determination 2–90 quick start 2–1 memory HAFM
Index displayed 1–30 port list view menu 1–30 port menu 1–29 port properties dialog box 1–29 ports displaying statistics 1–34 WWN, node list view 2–73 ports list view 1–29 power off procedure 3–35 power supplies 1–18 illustrations 5–2 LEDs 1–20 part numbers 5–2 removal 4–4 replacement 4–5 power supply events, event codes tables B–11 preventive maintenance, cleaning fiber-optic components 3–33 product management FICON 1–4 FMS 1–4 inband access 1–4 OSMS 1–4 Product Manager alert symbols 1–26 diagnostic featu
Index shortwave 1–18 wrap plug 1–43 simple network management protocol See SNMP SNMP introduction 1–3, 1–7 trap message support 1–41 software diagnostic features 1–20 installing 3–51 upgrading 3–51 specifications, remote workstations 1–16 specifications, switch 1–9 square, gray, meaning of 1–35 statistics on ports 1–34 status bar 1–34, 1–35 status bar symbols 1–35 status table 1–25 subnet mask default 2–1, 3–2 swapping ports 3–30 switch audit logs 3–6 connectors and indicators 1–19 description 1–2 error-de
Index Zone sets 3–17 WWN, zone member 3–18 W Z web server introduction 1–3 web server, embedded 1–12 Windows 2000 1–12 wrap plug, fiber-optic 1–43 WWN node list view 2–73 Zip drive 1–12 zone set description of 1–7 zone set tab 1–37 zone sets tab, illustration 1–37 Zone sets View 3–17 zoning 1–7 edge switch 2/16 service manual Index–7