
HP StorageWorks XP24000 Continuous Access Software User and Reference Guide, v01 (T5278-96002, June 2007)
•
Displaying the usage monitor graph (see “Displaying the Usage Monitor Graph”onpage90),
and
•
Exporting the usage monitor data file (see “Exporting the Usage Monitor Data File” on page 92).
Starting and S
topping Usage Monitoring
To make settin
gs for star ting and stopping the monitor, use Performance Monitor. For procedures to start
andstopthe mo
nitor, see the HP StorageWorks XP24000 Performance Monitor User’s Guide.
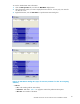
Displaying the Usage Monitor Graph
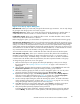
When usage monitoring is running, the Usage M onitor window can display user-selected remote copy
I/O
statistics in real time.
The usage monitor graph plots the user-selected I/O statistics (up to 65 data points) on an x-y graph. The
x-axis displays time. The y-axis displays the number of I/Os during the last sampling period. The legend
(right side of the graph) indicates the data being displayed. A value on the y-axis varies according to the
maximum value of the statistical data that is displaying. If the value on the y-axis exceeds 10,000,000,
the
value is displayed in exponential notation (for example, 1E7 = 1×10
7
= 10,000,000 ; 2E8 = 2×10
8
= 200,000,000). The Update field d isplays the most recent data sample time for the data on the graph.
To display the usage m onitor graph:
1. Make sure that usage monitoring is running (M o nitoring Switch = Enable). The usage monitor
graph ca n only be displayed when monitoring is on.
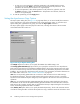
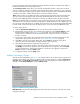
2. Right-click the graph area of the Usage Monitor window, and click Display Item to open the
Display Item dialog box (see Figure 36 on page 91).
3. To display I/O statistics for a ll LDEVs to be monitored in the storage system, click All Volumes.
To display I/O statistics for a specificvolume, click Volume, and then enter the desired volume
by selecting the port and entering the GID (00-FE) and LUN (000-7FF).
Note:
If you specify a n
unmounted volume, the graph is not displayed.
Note:
The LDKC number:CU number:LDEV number is displayed on the top of the g raph. If #
is added to the end of an LDEV number (for example, 00: 00:3C#) , the LDEV is an external
volume. For details on external volumes, see the HP StorageWorks XP24000 External Storage
Software User’s Guide.
To display I/O statistics for the sidefile data, click CLPR, and then select the desired CLPR from
the
drop-down list.
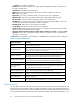
4. In the Monitor Data box, select the I/O statistics data that you want to display on the g raph. You
must click at least one box. Table 20 on page 91 describes the I/O statistics data.
Note:
To display the Average Transfer Rate, Pair Synchronized, or SideFile, you cannot select
any other statistics at the same time. The graph can only display one type of d ata at a time:
I/O
count, rate, or percent.
5. Click Set to close the Display Item dialog b ox. The Usage Monitor window now displays a graph
showing the selected I/O statistics data for the selected LU(s).
To enlarge the displayed graph, right-click the graph, and click the Large Size command. To
return the graph to normal size , right-click the graph, and click the Normal Size command.
Note:
The host group name will b e indicated in up to 8 characters at the top of the graph if the Normal
Size command is clicked. To check the host group name, magnify the graph.
Note:
To stop displaying the usage monitor graph, right-click the graph, and click Close.To stop
displaying all graphs, click Close All. The usage m onitor graph closes automatically in the following cases:
• When you click another tab,
• When you select another program p roduct, or
• When you exit the Remote W eb Console software.
90
Performing Continuous Access Configuration Operations