
HP StorageWorks XP Continuous Access User Guide: HP XP12000 Disk Array, HP XP10000 Disk Array, HP 200 Storage Virtualization System (T1711-96025, May 2011)

legend to the right of the graph indicates data being displayed. If a value on the y-axis exceeds
10,000,000, the value is displayed in exponential notation. For example,
1E7 = 1x10
7
= 10,000,000 and 2E8 = 2x10
8
= 200,000,000. The Update area displays the
most recent data sample time for data on the graph.
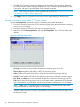
1. Click the Usage Monitor tab.
2. Verify that usage monitoring is running (Status = Running). The usage monitor graph can be
displayed only when monitoring is on.
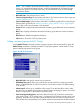
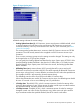
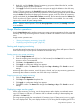
3. Right-click the graph area, and click Display Item. The Display Item pane appears.
Figure 49 Display Item pane
4. To display I/O statistics for all LDEVs in the subsystem, click Subsystem Total. To display I/O
statistics for a specific LU, click LU, and enter the LU by selecting the port from the drop-down
list and entering the group (00-7F) and LUN (00-FF).
NOTE: CU:LDEV is displayed on the top of the graph. If # is added to the end of the LDEV
number, such as 00:3C#, the LDEV is an external volume. For details about external volumes,
see the HP StorageWorks XP External Storage Software user guide: HP XP12000 Disk Array,
HP XP10000 Disk Array, HP 200 Storage Virtualization System.
To display I/O statistics for the sidefile data, select CLPR, and select the CLPR from the
drop-down list.
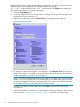
5. In the Monitor Data area, select the I/O statistics data to display on the graph. Select at least
two check boxes. “Remote copy I/O statistics” (page 91) describes I/O statistics data.
90 Performing XP Continuous Access configuration operations