PolyServe MxS Oracle Database Solution Pack Advanced I/O Monitoring User’s Guide February 2004
Copyright © 2004 PolyServe, Inc. Use, reproduction and distribution of this document and the software it describes are subject to the terms of the software license agreement distributed with the product (“License Agreement”). Any use, reproduction, or distribution of this document or the described software not explicitly permitted pursuant to the License Agreement is strictly prohibited unless prior written permission from PolyServe has been received.
Contents Advanced I/O Monitoring Introduction . . . . . . . . . . . . . . . . . . . . . . . . . . . . . . . . . . . . . . . . . . . . . . . . . . .1 MxODM I/O Monitoring: Features at a Glance . . . . . . . . . . . . . . . . . . . . .2 Core Reporting Elements . . . . . . . . . . . . . . . . . . . . . . . . . . . . . . . . . . . . .2 Reporting Levels . . . . . . . . . . . . . . . . . . . . . . . . . . . . . . . . . . . . . . . . . . . .3 Special Reports . . . . . . . . . . . . . . . . . . . . . . . . . . . .
Advanced I/O Monitoring Introduction Oracle Database Administrators routinely include operating-system level performance monitoring tools such as vmstat(8) and iostat(1) in their tuning efforts. Combining Oracle-provided monitoring tools with these operatingsystem tools is usually sufficient in SMP environments hosting single, or very few, database instances.
Advanced I/O Monitoring 2 The PolyServe MxS Oracle Database Solution Pack (MxODM) with the mxodmstat(8) command is the perfect compliment to the performance monitoring tools provided by Oracle Corporation. MxODM I/O Monitoring: Features at a Glance PolyServe has implemented the Oracle Disk Manager specification in the MxODM product.
Advanced I/O Monitoring 3 Reporting Levels The Core Reporting Elements can be provided at the following levels: • Cluster-Wide Level Provides aggregate information for all database instances on all nodes. • Database Global Level Limits information to a named database (e.g., PROD, DEV, FIN, DSS). • Instance Level Limits information to a named instance (e.g., PROD1, PROD8, DEV1, FIN4, DSS_6). • Node Level Limits information to a named node (e.g., rac1.acme.com, rac6.acme.com).
Advanced I/O Monitoring 4 allows DBAs to get a top-level view of the impact PQO is having on the cluster, either as a whole or at the node level. • Log Writer. This query focuses on only the lgwr processes and their activity at the cluster level, database level, or node level.
Advanced I/O Monitoring 5 Environment variables are passed through the lsnrctl process to the listener daemons. Hence, before starting a listener for the PROD database on a given node, set the $ORACLE_SID and $MXODM_DBNAME environment variables. The following example depicts a session starting a listener process that will accept a connect request to access the PROD database through the PROD1 instance. All activity by server processes begat of this listener will be accounted for accordingly.
Advanced I/O Monitoring 6 MxODM I/O Monitoring: Practical Examples This section offers several practical examples of the powerful I/O monitoring capability of the mxodmstat(8) command. The examples use a question and answer format, where the answer includes an mxodmstat(8) command and its output. The system used for these examples was a six-node, dual-processor, Intel-based cluster with PolyServe Matrix Server 2.1 and Oracle9i Real Application Clusters version 9.2.0.4.
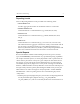
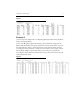
Advanced I/O Monitoring 7 Figure 1 Example 2 Question: How can I display the Core Reporting Elements broken out by database with 3-second granularity? Answer: The -D option supports monitoring a list of databases. In Figure 2, the BENCH and DEV databases are being monitored as cluster-wide entities. As such, the data under the “bench” column represents activity from all of the instances accessing the “bench” database—in this case, four instances.
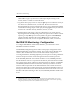
Advanced I/O Monitoring 8 Example 3 Question: I have a very complex Oracle9i RAC environment. How can I get a “birds-eye” view of cluster-wide Database Writer activity such as I/O response times and what percentage is that of cluster-wide I/O? Answer: Monitoring particular database “subsystems” such as Database Writer, Log Writer, or PQO processes as entities is possible with the -Q option. In Figure 3, -Q is specified without an accompanying -D option.
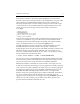
Advanced I/O Monitoring 9 • Large Data. I/O transfers of sizes greater than 16K are reported under this column. Generally, these will be full table scan driven (e.g., db file scattered read or direct path read,direct path write). • OLG. This column is for Online Redo Log I/O activity (e.g., LGWR). • ALG. This column is for Archived log activity (e.g., ARCH). • Sort. This column tracks I/O operations to/from temporary tablespaces (e.g., sorting). • Other.
Advanced I/O Monitoring 10 Figure 5 Example 6 Question: I have started a script on node 5 of the cluster which adds a large amount of space to the BENCH database. There is also a DEV database instance active on node 6. I'd like to monitor I/O activity of these two instances specifically but they are instances from two different databases. How can I monitor this activity? Answer: The -I option returns instance-level information regardless of what database is being accessed.
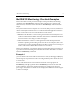
Advanced I/O Monitoring Figure 6 11