
3.6.1 HP PolyServe Matrix Server Administration Guide (T5392-96018, August 2008)

Chapter 15: Performance Monitoring 194
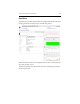
The Add Counters dialog will now display individual volume objects for
the filesystems listed in the vol_whitelist.conf file. If more than 64
filesystems are listed in the file, the dialog will display objects for the first
63 filesystems in the file. It will also display the object
MxS$Volume$_PRUNE_vol_whitelist.conf to notify you that the file
contains more filesystems than Perfmon can display. To view filesystems
that are not listed in the volume objects, take one of these actions:
• Reduce the number of filesystems in the vol_whitelist.conf file to less
than 64, keeping the filesystems of interest.
• Add the filesystems of interest to the vol_whitelist.conf file on another
cluster node and run the Perfmon utility on that node.
Processing the vol_whitelist.conf file and the volume objects is an
expensive operation. Typically the system can process the file within five
minutes. However, if the cluster state is undergoing many changes such
as nodes joining or leaving the cluster or volumes being added or
removed, the system may slow down updates of the Performance objects
to up to once every two hours.
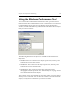
If you need the vol_whitelist.conf file to be processed immediately, run the
following commands in sequence:
net stop mxperfsrv
net start mxperfsrv
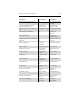
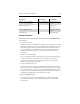
Matrix Server Metrics and Counters
Performance Dashboard Metrics
The metrics provided with the Performance Dashboard are as follows.
Description Matrix Metric Node Metric
Average CPU consumption % % Processor Time % Processor Time
Average CPU load (one minute) Proc Queue Length
(1 min)
Proc Queue Length
(1 min)
Average CPU load (five minutes) NA Proc Queue Length
(5 min)