
3.6.1 HP PolyServe Matrix Server Administration Guide (T5392-96018, August 2008)

Chapter 15: Performance Monitoring 184
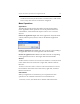
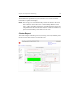
The dashboard opens in the browser with a full view of the cluster to
which the connected node belongs (the Cluster Report). You will need to
authenticate to the dashboard by entering the fully qualified NTLM
(DOMAIN\User) or UPN (user@FQDN) credentials.
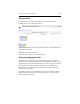
Performance Views
The Performance Dashboard provides the following metrics for the entire
cluster:
• Cluster Report. Reports processor, memory, network, and filesystem
metrics for the entire cluster over the selected time period (the default
is one hour).
• Physical View. Reports hardware configuration information.
• Filesystem Aggregate View. Reports total filesystem throughput and
total filesystem I/O operations for selected filesystems.
• Filesystem Detail View. Reports filesystem throughput and I/O
operations data for one filesystem. Data is reported for each node and
the total is reported for the entire cluster.
• Metrics View. Reports the selected metric across all nodes in the
cluster.
Performance information is also available for individual nodes. Use the
Grid menu on any of the cluster views to select the node that you want to
monitor, or click a graph for that node. Only one node can be displayed at
a time. If you need to monitor multiple nodes, open a browser for each
node.
The following information is available for individual cluster nodes:
• Host View. Reports uptime and CPU information and lists
performance metrics for the selected node.
• Node View. Reports hardware and software configuration
information for the selected node.
• Host-specific Filesystem View. Reports filesystem throughput and
filesystem I/O on the node for up to five PSFS filesystems.