
3.5.1 Matrix Server Administration Guide

Chapter 16: Performance Monitoring 263
Copyright © 1999-2007 PolyServe, Inc. All rights reserved.
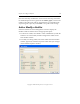
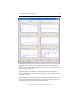
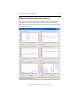
The bar in the center of the display shows the current, minimum,
maximum, and average value for the instance of the counter that is
highlighted on the bottom of the window (the aggregate instance in this
example). The values are calculated based on the samples that are visible
on the graph, not over the time that has elapsed since monitoring was
started. The Duration field specifies the maximum amount of time that
can be displayed on the graph (250 seconds).
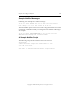
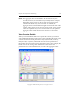
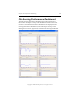
You can sort the display according to a particular column. Click the
column heading to perform the sort. An up arrow in the column heading
indicates that the column is sorted in ascending order. A down arrow
indicates that the column is sorted in descending order.
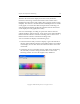
You can customize the display in the following ways:
• Select the instances that you want to display. A green check mark in
the first column indicates that the corresponding instance is included
in the display. You can click in the first column to add or remove the
check mark.
• Change the color for a particular instance. Click on the cell showing
the color that you want to change and then select a color on the
following window. To restore the original color, click Reset.