
3.5.1 Matrix Server Administration Guide

Chapter 16: Performance Monitoring 261
Copyright © 1999-2007 PolyServe, Inc. All rights reserved.
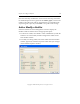
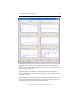
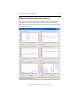
The display includes six performance counters. Each counter shows the
aggregate value of that counter for all of the servers in the matrix. For
example, the average CPU utilization counter shows the average for the
CPUs on all of the servers.
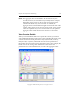
The status panel at the bottom of the display includes a timestamp
showing when the last set of data was received. A new sample is taken
every five seconds.
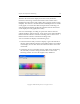
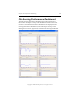
The Dashboard can display up to 140 seconds of historical data at a time,
starting from when the Dashboard was opened. New data points push
old data points out of the display after 140 seconds.