
3.1.2 MxFS-Linux Administration Guide

Chapter 4: Using the Applications Tab and Performance Dashboard 42
Copyright © 1999-2006 PolyServe, Inc. All rights reserved.
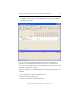
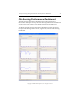
The File Serving Performance Dashboard displays most of the counters
provided on the Matrix Performance Dashboard and also includes the
following NFS counters.
• Total NFS Transfer Rate (MB/s). The amount of data (in Megabytes)
that has been moved across NFS.
• Total NFS Operations/sec. The total number of RPC calls that NFS
clients have made.
• Total NFS connections. The approximate number of NFS clients that
have been recently active. The number is based on the number of NFS
clients that exist in the authorization cache. This monitor can be used
to check load balancing of the NFS clients across the servers in the
matrix.
The File Serving Performance Dashboard shows the aggregate value for
each counter. Click the Detail button to see information for each
individual instance.
You can also display the File Serving Performance Dashboard for a
particular server. Select the Export Group for that server, right-click, and
select File Serving Dashboard for Server.