
HP StorageWorks Storage Mirroring Reporting Center user's guide (T2558-96324, April 2009)

5 - 18
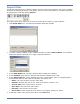
Series styles
All two-dimensional charts including trend, area, bar, and pie charts let you change the colors used
to represent a different data series within the chart.
To modify the colors used by a data series:
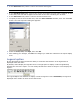
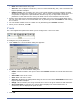
1. Click Series Styles icon. The Style Editor dialog box appears.
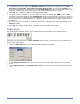
2. The Style Editor dialog box contains a list of all of the series styles that are defined for a report.
By default, the list is empty.
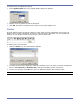
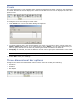
3. Click Add to add a new series style, or select an existing series and click Edit . The Style Editor
dialog box appears.
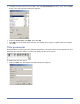
4. In the Label field, enter the name of the series for which the color will be changed.
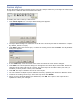
5. Click Edit. The Color Properties dialog box will appear. The Series Style Color Editor allows the
changing of the color and style of a series. The Color Style can be either Solid (one color) or
Gradient (3 colors).Select a color, then click OK.
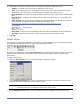
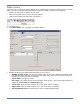
6. Click OK. The style is added to the list of series styles.
7. You can combine multiple styles for different series by repeating this action for different series.
8. To delete an existing series style, select the style then click Delete.
9. When you have finished adding style definitions, click OK. The report in the report area is
updated to reflect your changes.