
HP StorageWorks Storage Mirroring Reporting Center user's guide (T2558-96324, April 2009)

5 - 29
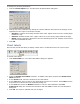
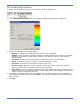
Connections dashboard
The Connections Dashboard displays the connection status, source disk queue utilization, and
protected time for a Storage Mirroring server or group of Storage Mirroring servers.
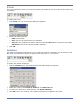
To run the Connections Dashboard, select a Storage Mirroring server in the tree. Right-click and
select Dashboards, Connections from the menu.
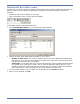
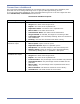
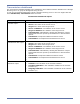
Connections dashboard reports
Report Information displayed
Connection status report
z Source—The name of the source server
z Target—The name of the target server
z Repset—The name of the replication set
z Replication State—The status of the replication set
z Mirror State—The status of the mirror
z Transmission State—The status of the transmission
z Target Paused—If selected, the target is not writing to disk
z Connected Time—The timestamp showing when the connection
was established
z Running—The time the connection has been running
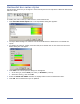
Source disk queue
utilization report
z Source—The name of the source server
z Mirror Queue—Bytes in mirror queue
z Replication Queue—Bytes in replication queue
z Disk Queue—The number of bytes in the source disk queue
z Memory Queue—Bytes in memory queue programmatically
calculated by adding mirror + replication - disk queue
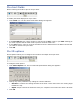
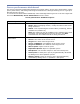
Storage Mirroring
protected time report
z Source—The name of the source server
z Target—The name of the target server
z Repset—The name of the replication set
z Protected Time—The percentage of time the data was protected
z Unprotected Time—The percentage of time the data was not
protected
z Mirror Time— The percentage of the unprotected time due to
mirror activity
z Mirror Duration—The amount of time for mirror activity
z Total Mirrors—The total number of mirror tasks