
Serviceguard Manager Version A.05.02 Release Notes, Third Edition, July 2009

What You See
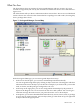
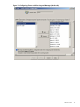
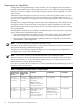
The figure below shows an instance of Serviceguard Manager with two sessions. (Up to 10
sessions are supported.) The icon by the connection to both Session Servers show that the user's
login is root.
The Alerts button tells you there is information about serious alerts. We can see a red-bordered
cluster is down. Also critical are the clusters that have a package icon with a red X, showing they
have a package that is down.
Figure 1-1 Serviceguard Manager: Tree and Map
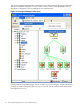
With Serviceguard Manager, you see Serviceguard objects three ways.
• In the tree on the left pane, you see cluster relationships listed hierarchically.
You can navigate through the map by clicking an object in the tree. The map pane will show
information relevant to the object you clicked. For example, if you click a node, you see that
node, its cluster, and the packages configured to run on it.
• In the map on the right pane, you can see configuration relationships by the position of
objects in the diagram. You can see status from the colors and symbols. You can also get a
small text message about the status if you pause the mouse over a cluster object.
• In Properties, you see more detailed information about any session, cluster, node, or package
on your map. To open Properties, select an object, then go to the menu on top. Or right-click
an object and use the pop-up menu.
What You See 13