
HP StorageWorks Reference Information Storage System V1.1 Administrator Guide (February 2005)

LO
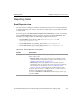
Chapter 2:
Platform Control Center
Nagios folder
2-72 HP StorageWorks Reference Information Storage System Administrator Guide, February 2005
The charts
Passive Service Checks
are
not used
; all PCC service checks are
active.
Related Views
•
Hostgroup Information view
, on page 2-121, presents the same
monitoring performance information, but for a single host group (and
you can execute host group commands).
•
Tactical Monitoring view
, on page 2-50, also provides limited information
about monitoring performance.
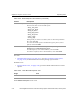
Table 2-53: Nagios Stats view features
Feature Description
Time Frame/
Checks Completed
Number and percentage of PCC services checked in
each indicated time frame (since PCC startup or in the
last 1, 5, 15, or 60 minutes).
Metric/Min/Max/Average
• Check Execution Time
• Check Latency
Minimum, maximum, and average times:
• it took to check a service
• between time a service check was scheduled and time
it was executed
(Percent State Change is
not used
.)
Table 2-54: Links
to
Nagios Stats view
Origin Link
left menu Nagios Stats
Tactical Monitoring view
, on
page 2-50
Monitoring Performance
Table 2-55: Links
from
Nagios Stats view
Destination Link
Service Detail view
, on page 2-53
Active Service Checks (
<#>
Total )