
HP StorageWorks Reference Information Storage System V1.1 Administrator Guide (February 2005)

Alerts folder Chapter 2:
Platform Control Center
HP StorageWorks Reference Information Storage System Administrator Guide, February 2005 2-95
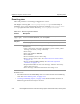
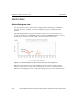
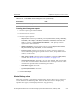
value. For example, the following histogram shows only recovery (
OK
) events
for the same time period. The
OK
event line from 11:15 to 13:15 was hidden
by
CRITICAL
and
WARNING
event lines in the previous histogram.
Figure 2-3: Alerts histogram of recovery service events over one-day period
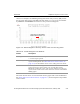
The same status colors are used in both charts: graph and event breakdowns.
See
Host and service status values
, on page 2-14, for descriptions of possible
status values.
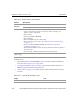
Table 2-73: Alerts Histogram view features
Feature Description
heading • Name of host or service reported on.
• Covered report period.
Event History Color-coded graph indicating host/service event history over
reported time period. See
Host and service status values
, on
page 2-14
, for information about color coding of status values.
event breakdowns Summary chart showing number of events associated with
each host/service status value over covered time period.
Minimum, maximum, total, and average number of events are
reported. The same status value colors are used as in the Event
History graph.
OK Event Line Was Hidden
Behind Warning Event Line