
HP RIP Software - User Guide


Creating a Color Profile 4-17
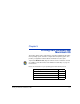
18. Click the Next ( ) button to continue.
The Linearization Curves tab appears.
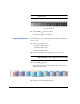
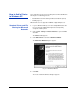
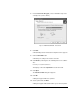
Linearization Curves This tab allows you to view the linearization curves created by the
data that was input in the previous step. You can view the curves
for each ink color a graph and optionally print out the 9-ramp test
chart for visual inspection.
You should be able to see a difference in density between every
patch. If at some percentage you cannot detect a difference, the ink
limit should be lowered to that percentage for that color. To change
the ink limit, go back to the Set Ink LImits tab and relinearize.
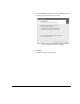
19. Click the Next ( ) button to continue.
The Total Ink Limit tab appears.
Total Ink Limit 20. Click the “Print total ink limit (TIL) chart” button to print the global
ink chart. (If you already know the value you will enter, you can
check the “Skip TIL-chart print” box to skip printing the chart.)
21. Examine the higher ink coverage end of the global ink limit chart for
excessively heavy ink coverage and/or lack of curing (UV inks).
Enter a value below this point for the global ink limit.
Fig. 4-8. 9-ramp test chart