
HP P6000 Continuous Access Implementation Guide (T3680-96431, August 2012)
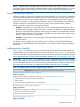
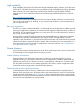
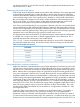

Figure 3 Threat categories based on radius
1. Regional threat (radius between 10 and 100 kilometers, affecting up to 314,000 square kilometers)
2. Metropolitan threat (radius between 1 and 10 kilometers, affecting up to 314 square kilometers)
3. Local threat (radius less than 1 kilometer, affecting 3 square kilometers)
When determining the threat radius, identify the threats to both sites and the specific threat range.
Sample threats include tornados, fires, flood, power loss, chemical incidents, earthquakes,
hurricanes, and typhoons. Consider the shape, center, and direction of each threat. For example,
if severe storms tend to travel in a specific direction, you can place the second site perpendicular
to the expected route of travel from the first site. If multiple threats range in size and severity,
develop your solution for the largest threat.
Distance and performance
HP P6000 Continuous Access can move data at extreme distances. However, the speed of light
in fiber optic cables (1 millisecond per 100 kilometers, round trip) causes inherent delays, called
latency. At extreme distances, latency is the limiting factor in replication performance, regardless
of bandwidth. Latency becomes an even larger factor when switched IP networks are used to
replicate data.
IMPORTANT: Intersite latency may impact your applications. You must ensure that all applications
can accommodate the intersite latency interval. This is important when using synchronous write
mode because every write I/O will incur the intersite latency.
Latency factor
The greater the distance, the greater the impact intersite latency has on replication performance.
For example, a 1-block write that completes in 0.25 milliseconds without replication takes 0.35
milliseconds to complete with synchronous replication and zero distance between copies. Add
100 kilometers of cable and the replication of that block takes 1.35 milliseconds. The additional
millisecond is the time it takes for the data to travel 100 kilometers to the destination array and
for the acknowledgement to travel 100 kilometers back to the source array. Add another 100
kilometers of cable, and the same write requires 2.35 milliseconds.
NOTE: When replicating synchronously, the total write I/O service time latency is the sum of the
write I/O service time on the local array, plus the round-trip network latency, plus the write I/O
service time on the destination array. On slow links, queuing effects (I/Os waiting in the queue
for transfer over the network) can introduce additional latency, extending the total write I/O service
time far beyond that imposed by the other factors mentioned.
16 Designing a remote application solution