
HP StorageWorks XP24000 Continuous Access Journal Software User and Reference Guide, v01 (T5278-96001, June 2007)


8 Us age Monitor Operations
Reviewing the Usage M onitor Window
The Usage Monitor window enables you to collect I/O statistics for all volumes to be monitored o n
the
connected storage system. The I/O statistics that are displayed in the window are collected by
Performance Monitor. The Usage Monitor window is able to display the data for remote copy operations.
At each data sampling time interval that is specified from Per formance Monitor, the Usage Monitor
window collects 1,440 pieces of data for each volume and up to 1,440 pieces of data for all the
volumes to be monitored.
The usage monitoring operations are:
•
Displaying the Usage M onito r window (see “Usage Monitor Window”onpage90),
• Starting and stopping monitoring (see “Starting and Stopping Usage Monitoring” on page 141),
• Displaying the usage mo nitor graph (see “D isplaying the Usage Monitor Graph” on page 141),
and
•
Saving monitoring data in text files (see “Saving Monitoring Data in Text Files”onpage143).
Starting and Stopping Usage Monitoring
Starting and stopping usage monitoring can be set using Performance Monitor. For details about starting
and
stopping usage monitoring, see HP StorageWorks XP24000 Performance Monitor User’s Guide.
Displaying the Usage Monitor Graph
When usage m onitoring is running, the Usage Monitor window can display user-selected remote copy
I/O
statistics i n real time.
The usage monitor graph plots the user-selected I/O statistics (up to 65 data points) on an x-y graph.
Thex-axisdisplaystime. They-axisdisplaysthe number of I/Os during thelastsamplingperiod. The
legend (right side of the graph) indicates the data being displayed. The value on the y-axis varies
according to the maximum value of the statistical data that is displaying. If the value on the y-axis
exceeds 10,000,000 , the value is displayed in exponential notation (for example, 1E7 = 1×10
7
=
10,000,000; 2E8 = 2×10
8
= 200,000,000).
To display the usage monitor graph:
1. Make sure that usage monitoring is running (Monitoring Switch = Enable). The usage monitor
graph can only be displayed when monitoring is on.
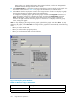
2. Right-click the graph area in the Usage Monitor window, a nd select Display Item to op en the
Display Item window (see Figure 68 on page 142) .
3. Select an appropriate radio button in Sel ect Volume, following the instructions below:
• To display I/O statistics for all LDEVs to be monitored in the storage system, select All
Volumes.
• To display I/O statistics for a specific journal group, select JNL Group, and then enter
ajournal groupnumber (00-FF).
Note:
If you specify an unused journal group, the graph is not displayed.
•To display I/O statistics for a specifi cLU, select Volume, and then specify the desired LU by
selecting a port (CL1-A to CLG-R) and entering the GID (00-FE) and LUN (00-7FF).
Note:
If you specify the unmounted volume, the graph is not displayed.
Note:
When a graph displays, the LDKC number, the CU number and the LDEV number
appear above the graph. If the volume is an external volume, the # symbol appears after the
XP24000 Continuous Access Journal Software User a nd Reference Guide
141