
HP StorageWorks Continuous Access XP user guide for the XP10000/XP12000 (December 2005)

Continuous Access XP user guide for the XP10000/XP12000 83
2E8=2x10
8
= 200,000,000. The Update area displays the most recent data sample time for data on the
graph.
1. Click the Usage Monitor tab.
2. Verify that usage monitoring is running (Status = Running). The usage monitor graph can be displayed
only when monitoring is on.
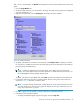
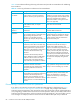
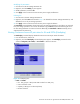
3. Right-click the graph area, and click Display Item. The Display Item pane appears.
Figure 49 Display Item pane
4. To display I/O statistics for all LDEVs in the subsystem, click Subsystem Total. To display I/O statistics
for a specific LU, click LU, and enter the LU by selecting the port from the drop-down list and entering
the group (00-7F) and LUN (00-FF).
NOTE: CU:LDEV is displayed on the top of the graph. If # is added to the end of the LDEV
number, such as 00:3C#, the LDEV is an external volume. For details about external volumes, see
the HP StorageWorks External Storage XP User Guide.
To display I/O statistics for the sidefile data, select CLPR, and select the CLPR from the drop-down list.
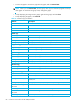
5. In the Monitor Data area, select the I/O statistics data to display on the graph. Select at least two
check boxes. Table 23 describes I/O statistics data.
NOTE: To display Average Transfer Rate, Average Response, or Pair Synchronized, do not select
any other statistics at the same time. The graph can display only one type of data at a time: I/O
count, rate, response time, or percent.
6. Click Set. A graph showing selected I/O statistics data for the selected LUs appears.
7. Complete the following tasks if needed:
• To enlarge the displayed graph, right-click the graph, and click Large Size.