
HP StorageWorks Continuous Access XP Journal user guide (T1778-96001, June 2006)


Continuous Access XP Journal user guide 137
maximum value of the statistical data displayed. If the value on the y-axis exceeds 10,000,000, the value
is displayed in exponential notation (for example, 1E7 = 1x10
7
= 10,000,000;
2E8=2x10
8
= 200,000,000).
1. Ensure that usage monitoring is running. The usage monitor graph is only displayed when monitoring
is on.
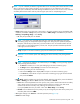
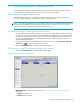
2. Right-click the graph area on the Usage Operations pane, and click Display Item. The Display Item
pane (Figure 61) appears.
3. In Select LU, do one of the following:
• To display I/O statistics for all LDEVs in the array, select Subsystem.
• To display I/O statistics for a specific journal group, select JNL Group, and enter a journal group
number (00-FF).
NOTE: If you specify an unused journal group, the graph is not displayed.
• To display I/O statistics for a specific LU, select Device, select a port (CL1-A to CLG-R), and enter
the G-ID (00-FE) and LUN (00-3FF).
NOTE: If you specify the unmounted LU, the graph is not displayed.
NOTE: When a graph displays, the CU and LDEV numbers appear above the graph. If the
logical volume is an external LU, # appears after the LDEV number. For more information about
external LUs, see the HP StorageWorks External Storage XP user guide.
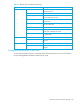
4. In the Monitor Data box, select the I/O statistics data you want to display on the graph. You must
select at least one box. Table 28 describes I/O statistics data.
5. Click Set. The Usage Operations pane now displays a graph showing the selected I/O statistics data
for the selected LUs.
To enlarge the displayed graph, right-click the graph, and select Large Size. To return the graph to
normal size, right-click the graph, and select Normal Size.
NOTE: The length of a host group or iSCSI target name in the upper portion of the graph is
limited to a maximum of eight characters when the graph is normal size. To display a full host
group name, enlarge the graph. To find a full iSCSI target name, look at the tree in the Pair
Operation pane. If you enlarge the graph, the length of an iSCSI target name increases to a
maximum of 32 characters.
NOTE: To stop displaying the usage monitor graph, right-click the graph, and select Close. To stop
displaying all graphs, select Close All. The usage monitor graph automatically closes when you do one of
the following:
• Select another tab.
• Select another program product.
• Exit Command View XP or XP Remote Web Console.