
HP StorageWorks Continuous Access XP Journal user guide (December 2005)

Continuous Access XP Journal user guide 127
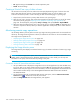
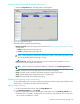
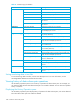
4. In the Monitor Data box, select the I/O statistics data you want to display on the graph. You must select
at least one box. Table 27 describes I/O statistics data.
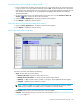
5. Click Set to close the Display Item pane. The Usage Operations pane now displays a graph showing
the selected I/O statistics data for the selected LUs.
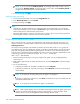
To enlarge the displayed graph, right-click the graph, and select Large Size.
To return the graph to normal size, right-click the graph, and select Normal Size.
NOTE: When the graph is normal size, the length of a host group name displayed in the upper
part of the graph is limited to a maximum of eight characters. To display a full host group name,
enlarge the graph.
NOTE: To stop displaying the usage monitor graph, right-click the graph, and select Close. To stop
displaying all graphs, select Close All. The usage monitor graph closes automatically in the following
cases:
• Select another tab.
• Select another program product.
• Exit Command View XP or XP Remote Web Console.
• Stop the usage monitoring function by selecting Disable in the Monitoring Switch box, and clicking
Apply.
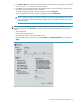
Figure 60 Display Item pane