
HP StorageWorks Auto LUN XP user guide for the XP128/XP1024 (December 2005)
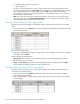
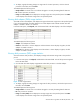
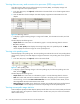
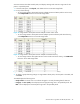
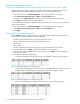
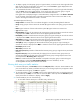
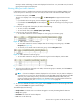
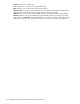
Table Of Contents
- Contents
- Auto LUN XP for the XP128/XP1024
- Auto LUN XP features
- Auto LUN XP tasks
- Reserve volumes
- Volume migration
- Estimating usage rates
- Automatic migration
- Manual migration
- Requirements and restrictions
- Starting Auto LUN XP
- Creating and executing migration plans
- Troubleshooting Auto LUN XP
- Auto LUN/Performance Control Base Monitor for the XP128/XP1024
- Auto LUN statistics
- Usage statistics
- Collecting usage statistics about disk array resources
- Viewing parity group usage statistics
- Viewing logical volume usage statistics
- Viewing channel adapter (CHA) usage statistics
- Viewing channel processor (CHP) usage statistics
- Viewing disk adapter (DKA) usage statistics
- Viewing disk processor (DKP) usage statistics
- Viewing data recovery and reconstruction processor (DRR) usage statistics
- Viewing write pending rates
- Viewing access path usage statistics
- Workload and traffic statistics
- Index
Auto LUN XP user guide for the XP128/XP1024 49
iSCSI port. When calculating I/O rates to be displayed in the All Prio. row, Auto LUN uses I/O rates of
iSCSI ports and other prioritized ports.
Viewing HBA/port traffic statistics
If Performance Control is enabled, Auto LUN monitors paths between host bus adapters (HBAs) in host
servers and ports on disk arrays. You can view both I/O and transfer rates between HBAs and ports.
1. In the Auto LUN pane, click WWN.
The tree view displays a list of PFC groups ( ). The Not Grouped item appears below the PFC
groups.
• If you double-click a PFC group, host bus adapters ( ) in the PFC group are displayed.
• If you double-click Not Grouped, host bus adapters ( ) that do not belong to any PFC group are
displayed.
2. In the list on the right side of the pane, do either of the following:
•To view I/O rates, select IOPS.
•To view transfer rates, select 100KB/s (MB/s [XP 12000]).
3. In the tree view, do one of the following:
• To view traffic statistics for host bus adapters in a PFC group, click the PFC group.
Figure 32 Traffic statistics for host bus adapters
• To view traffic statistics for host bus adapters that do not belong to any PFC group, click Not
Grouped (see Figure 32).
• To view the I/O or transfer rates at each PFC group, click the Subsystem folder.
Figure 33 Traffic statistics for each PFC group
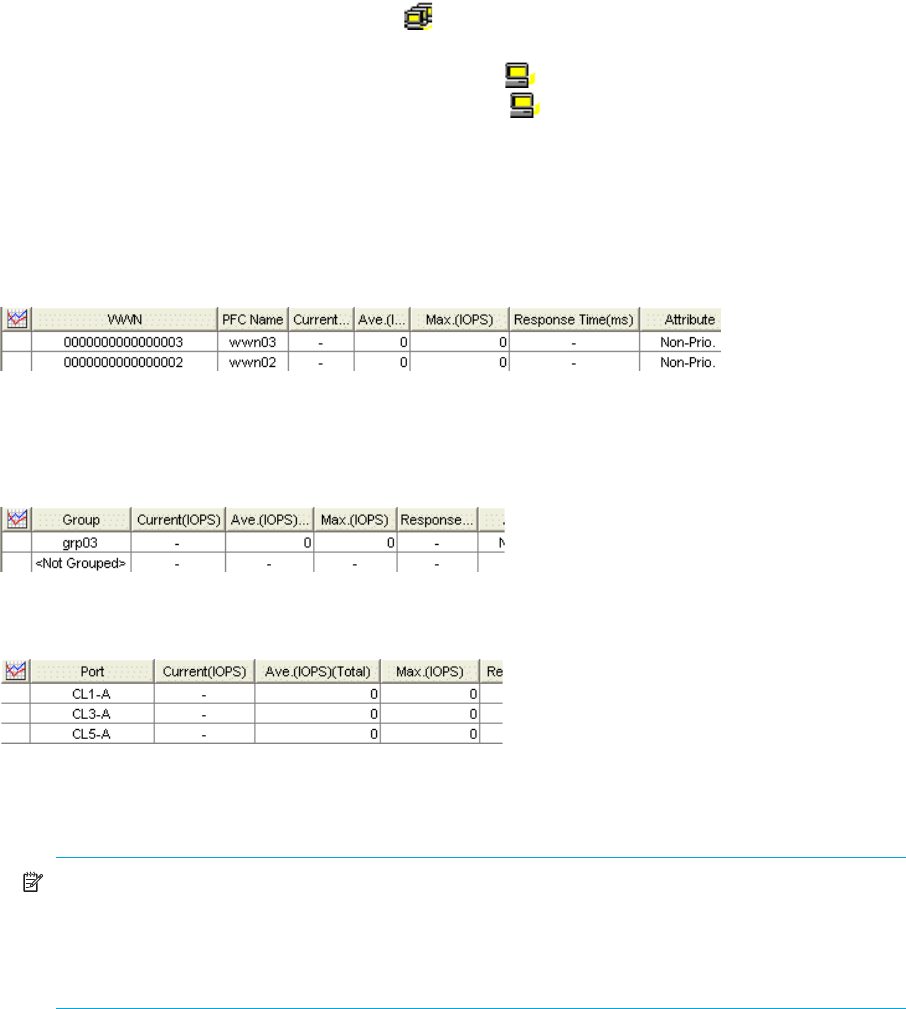
• To view traffic statistics for each port connected to a given host bus adapter, click the HBA.
Figure 34 Traffic statistics for each port connected to a specified HBA
4. To find out how traffic has changed, in the table, click the PFC groups or WWNs, and click Draw. A
graph appears below the table.
NOTE: If a host bus adapter’s WWN is displayed in red in the tree view, the host bus adapter is
connected to two or more ports, but Performance Control does not control traffic between the HBA
and some ports. When many-to-many connections are established between HBAs and ports,
monitor all traffic between HBAs and ports. For information about controlling traffic between the
HBA and connected ports, see ”Troubleshooting Auto LUN XP” on page 36.
5. To view more detailed information in the graph, click the Detail check box on the lower-right side of the
table, and click Draw. The graph contents change.
The table displays the following:
• Graph column: The check mark icon indicates the graph is currently illustrating data for that item.
• Group: PFC groups.
• PFC Name: PFC names of host bus adapters.
• Port: Ports on the disk array.