
HP StorageWorks Auto LUN XP user guide for the XP128/XP1024 (December 2005)
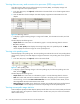
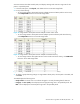
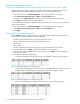
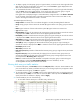
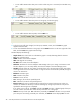
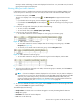
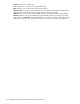
Table Of Contents
- Contents
- Auto LUN XP for the XP128/XP1024
- Auto LUN XP features
- Auto LUN XP tasks
- Reserve volumes
- Volume migration
- Estimating usage rates
- Automatic migration
- Manual migration
- Requirements and restrictions
- Starting Auto LUN XP
- Creating and executing migration plans
- Troubleshooting Auto LUN XP
- Auto LUN/Performance Control Base Monitor for the XP128/XP1024
- Auto LUN statistics
- Usage statistics
- Collecting usage statistics about disk array resources
- Viewing parity group usage statistics
- Viewing logical volume usage statistics
- Viewing channel adapter (CHA) usage statistics
- Viewing channel processor (CHP) usage statistics
- Viewing disk adapter (DKA) usage statistics
- Viewing disk processor (DKP) usage statistics
- Viewing data recovery and reconstruction processor (DRR) usage statistics
- Viewing write pending rates
- Viewing access path usage statistics
- Workload and traffic statistics
- Index
48 Auto LUN/Performance Control Base Monitor for the XP128/XP1024
• To view traffic statistics about host ports to which a disk array port is connected, click the disk array
port.
Figure 29 Traffic statistics about host ports to which a disk array port is connected
• To view traffic statistics about host ports in a host group, click the host group.
Figure 30 Traffic statistics about host ports in a host group
• To view traffic statistics about LU paths, click the LUN icon.
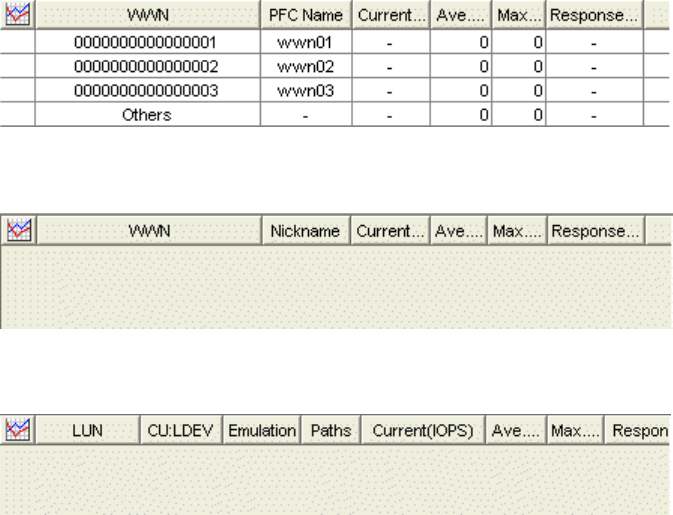
Figure 31 Traffic statistics about LU paths
4. To find out how traffic has changed, click the ports, WWNs, or LUNs, and click Draw. A graph
appears below the table.
5. To view more detailed information in the graph, click the Detail check box on the lower-right side of the
table, and click Draw. The graph contents change.
The table displays the following:
• Graph column: The check mark icon indicates the graph is currently illustrating data for that item.
• Port: Ports on the disk array.
• WWN: WWNs of the host bus adapters.
• LUN: LUNs (logical unit numbers).
• PFC Name: PFC names of host bus adapters.
• Nickname: Nickname for host bus adapters. LUN Manager allows you to assign a nickname to each
host bus adapter so you can easily identify each host bus adapter in the LUN Manager panes.
• CU:LDEV: Logical volume IDs. The number on the left of the colon is the CU image number. The number
on the right of the colon is the LDEV number. If a logical volume ID ends with the symbol #, the logical
volume is an external LU.
• Emulation: Emulation types.
• Paths: Number of LU paths.
• Current: Current I/O rate.
• Ave.: Average I/O rate for the specified period.
• Max.: Maximum I/O rate for the specified period.
• Response Time (ms): Time (in milliseconds) for replying from an external volume group when I/O
accesses are made from disk array to external volume group. Average response time in the period
specified for Monitoring Term is displayed.
If you select a port in the list, click Draw, and select the Detail check box, a detailed graph of the port
I/O rate is drawn. The Peak value means the top of the Max. line in this graph.
• Attribute: Priority of each port. Prio. indicates a prioritized port. Non-Prio. indicates a non-prioritized
port. iSCSI ports are always prioritized ports. Therefore, the Attribute column displays Prio. for each