
HP StorageWorks Auto LUN XP user guide for the XP128/XP1024 (December 2005)
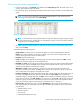
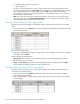
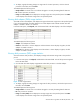
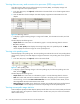
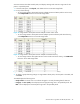
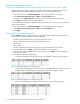
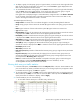
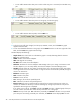
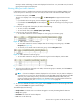
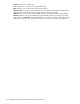
Table Of Contents
- Contents
- Auto LUN XP for the XP128/XP1024
- Auto LUN XP features
- Auto LUN XP tasks
- Reserve volumes
- Volume migration
- Estimating usage rates
- Automatic migration
- Manual migration
- Requirements and restrictions
- Starting Auto LUN XP
- Creating and executing migration plans
- Troubleshooting Auto LUN XP
- Auto LUN/Performance Control Base Monitor for the XP128/XP1024
- Auto LUN statistics
- Usage statistics
- Collecting usage statistics about disk array resources
- Viewing parity group usage statistics
- Viewing logical volume usage statistics
- Viewing channel adapter (CHA) usage statistics
- Viewing channel processor (CHP) usage statistics
- Viewing disk adapter (DKA) usage statistics
- Viewing disk processor (DKP) usage statistics
- Viewing data recovery and reconstruction processor (DRR) usage statistics
- Viewing write pending rates
- Viewing access path usage statistics
- Workload and traffic statistics
- Index
Auto LUN XP user guide for the XP128/XP1024 45
Auto LUN monitors these data transfer paths, and displays average and maximum usage rates for the
paths in a specified period.
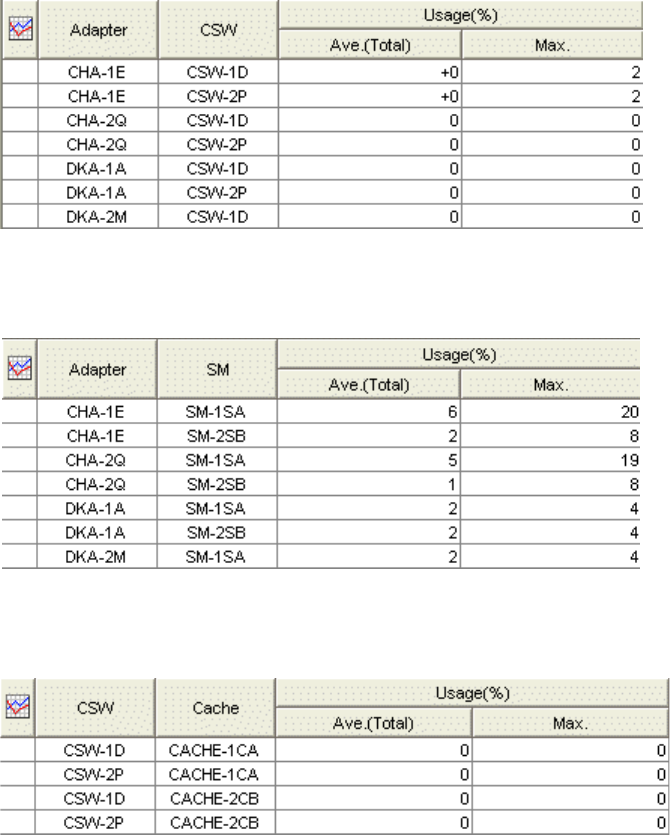
1. In the Auto LUN pane, click Physical, and double-click the Access Path Usage folder.
2. Do any of the following:
• To check usage statistics about paths between adapters (CHAs and DKAs) and the cache switch,
click Adapter-CSW below the Access Path Usage folder.
Figure 22 Usage statistics about paths between adapters and the cache switch
• To check usage statistics about paths between adapters (CHAs and DKAs) and shared memory,
click Adapter-SM below the Access Path Usage folder.
Figure 23 Usage statistics about paths between adapters and shared memory
• To check usage statistics about paths between cache switches and cache memory, click CSW-Cache
below the Access Path Usage folder.
Figure 24 Usage statistics about paths between cache switches and cache memory
3. To display a graph illustrating changes in usage statistics about paths, click the paths in the table, and
click Draw.
The table displays the following items:
• Graph column: The check mark icon indicates the graph is currently illustrating data for that item.
• Usage(%): The Ave. (Total) column displays the average path usage rate in the specified period. The
Max. column displays the maximum path usage rate in the specified period.