
HP StorageWorks Auto LUN XP user guide for the XP128/XP1024 (December 2005)
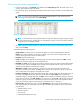
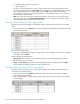
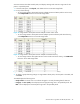
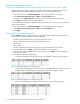
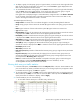
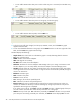
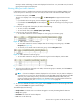
Table Of Contents
- Contents
- Auto LUN XP for the XP128/XP1024
- Auto LUN XP features
- Auto LUN XP tasks
- Reserve volumes
- Volume migration
- Estimating usage rates
- Automatic migration
- Manual migration
- Requirements and restrictions
- Starting Auto LUN XP
- Creating and executing migration plans
- Troubleshooting Auto LUN XP
- Auto LUN/Performance Control Base Monitor for the XP128/XP1024
- Auto LUN statistics
- Usage statistics
- Collecting usage statistics about disk array resources
- Viewing parity group usage statistics
- Viewing logical volume usage statistics
- Viewing channel adapter (CHA) usage statistics
- Viewing channel processor (CHP) usage statistics
- Viewing disk adapter (DKA) usage statistics
- Viewing disk processor (DKP) usage statistics
- Viewing data recovery and reconstruction processor (DRR) usage statistics
- Viewing write pending rates
- Viewing access path usage statistics
- Workload and traffic statistics
- Index
42 Auto LUN/Performance Control Base Monitor for the XP128/XP1024
• Hitachi® FlashCopy® Mirroring Version 2
•Volume Migration
This value is found by dividing access time to physical drives by the following programs by all the
access time to physical drives. The Ave. (Total) column indicates the average percentage of processing
in the specified period for the programs listed above. The Max. column indicates the maximum
percentage of processing of the programs listed above in the specified period. For more information,
see the programs’ documentation.
• CLPR: The number and name of the CLPR that corresponds to the parity group to which the logical
volume belongs, in the format CLPR number:CLPR name. For more information about CLPRs, see the
HP StorageWorks XP Disk/Cache Partition User Guide.
Viewing channel adapter (CHA) usage statistics
Auto LUN monitors channel adapters, and displays average and maximum usage rates in the specified
period.
1. In the Auto LUN pane, click Physical, and click the CHA folder. The table displays usage statistics about
channel adapters (CHAs).
Figure 16 CHA usage statistics
2. To display a graph illustrating changes in usage rates for channel adapters, click the channel adapters
in the table, and click Draw.
The table displays the following items:
• Graph column: The check mark icon indicates the graph is currently illustrating data for that item.
• ID: Channel processor ID numbers.
• Usage: The Ave. (Total) column displays the average usage rate in the specified period. The Max.
column displays the maximum usage rate in the specified period.
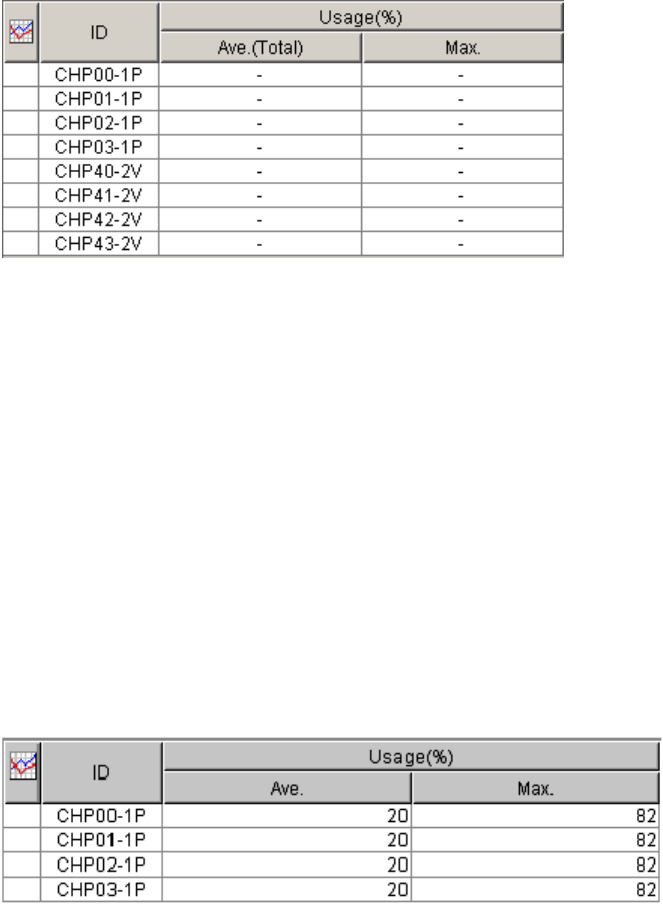
Viewing channel processor (CHP) usage statistics
Auto LUN monitors channel processors in each channel adapter, and displays average and maximum
usage rates in the specified period.
1. In the Auto LUN pane, click Physical, and double-click the CHA folder. A list of channel adapters
appears below the CHA folder.
2. Click a channel adapter. The table displays usage statistics about channel processors in the selected
channel adapter.
Figure 17 CHP usage statistics