
HP StorageWorks Auto LUN XP user guide for the XP128/XP1024 (December 2005)
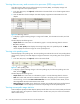
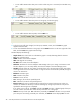
Table Of Contents
- Contents
- Auto LUN XP for the XP128/XP1024
- Auto LUN XP features
- Auto LUN XP tasks
- Reserve volumes
- Volume migration
- Estimating usage rates
- Automatic migration
- Manual migration
- Requirements and restrictions
- Starting Auto LUN XP
- Creating and executing migration plans
- Troubleshooting Auto LUN XP
- Auto LUN/Performance Control Base Monitor for the XP128/XP1024
- Auto LUN statistics
- Usage statistics
- Collecting usage statistics about disk array resources
- Viewing parity group usage statistics
- Viewing logical volume usage statistics
- Viewing channel adapter (CHA) usage statistics
- Viewing channel processor (CHP) usage statistics
- Viewing disk adapter (DKA) usage statistics
- Viewing disk processor (DKP) usage statistics
- Viewing data recovery and reconstruction processor (DRR) usage statistics
- Viewing write pending rates
- Viewing access path usage statistics
- Workload and traffic statistics
- Index
Auto LUN XP user guide for the XP128/XP1024 41
Viewing logical volume usage statistics
1. In the Auto LUN pane, click Physical, and double-click the Parity Group folder. The folder opens. A list
of parity groups appears below the folder.
2. Click the parity group. The table displays usage statistics about logical volumes in the specified parity
group.
NOTE: To view the ratio of Business Copy XP and ShadowImage for z/OS processing to all
processing in the physical drive, select Short Range.
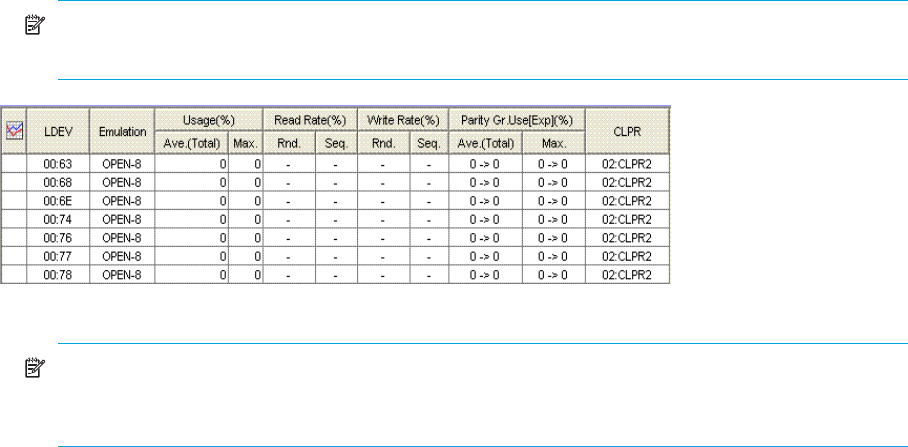
Figure 15 Logical volume usage statistics
NOTE: If an exclamation mark (!) appears before a usage rate, that parity group usage rate might
be inaccurate because the configuration has changed (for example, volumes have been moved by
a migration plan or changed by VSC).
3. To display a graph illustrating changes in usage rates for parity groups, click the parity groups in the
table, and click Draw.
The table displays the following items:
• Graph column: The check mark icon indicates the graph is currently illustrating data for that item.
• LDEV: Logical volumes (LDEVs). The number on the left of the colon is the CU image number. The
number on the right of the colon is the LDEV number.
• Emulation: Device emulation type.
• Usage: The Ave. column displays the average usage rate in the specified period. The Max. column
displays the maximum usage rate in the specified period.
• Read Rate: The Rnd. column indicates the random read rate, which is the ratio of random read requests
to read and write requests. The Seq. column indicates the sequential read rate, which is the ratio of
sequential read requests to read and write requests.
• Write Rate: The Rnd. column indicates the random write rate, which is the ratio of random write
requests to read and write requests. The Seq. column indicates the sequential write rate, which is the
ratio of sequential write requests to read and write requests.
• Parity Gr. Use[Exp](%): Expected (estimated) average and maximum usage rates of the parity group, if
the volume was migrated out of the group (or de-installed). The Ave. (Total) column indicates an
estimated change in average usage rate. The Max. column indicates an estimated change in maximum
usage rate. For example, if the Ave. (Total) box for volume 0:01 displays 20 -> 18, average usage rate
of the parity group to which the volume belongs is 20 percent. If the volume was migrated out of the
parity group, average usage rate of that group is expected to drop to 18 percent.
• Business Copy: (Displayed only when you select Short Range as the storing period of statistics.) For
each logical volume, the percentage of processing of the following programs to all processing of the
physical drives:
• ShadowImage for z/OS
•Business Copy XP
•Flex Copy XP
• Hitachi® FlashCopy® Mirroring