
HP StorageWorks Auto LUN XP user guide for the XP128/XP1024 (December 2005)
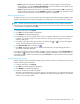
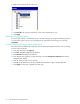
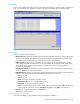
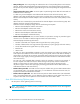
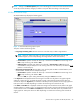
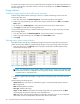
Table Of Contents
- Contents
- Auto LUN XP for the XP128/XP1024
- Auto LUN XP features
- Auto LUN XP tasks
- Reserve volumes
- Volume migration
- Estimating usage rates
- Automatic migration
- Manual migration
- Requirements and restrictions
- Starting Auto LUN XP
- Creating and executing migration plans
- Troubleshooting Auto LUN XP
- Auto LUN/Performance Control Base Monitor for the XP128/XP1024
- Auto LUN statistics
- Usage statistics
- Collecting usage statistics about disk array resources
- Viewing parity group usage statistics
- Viewing logical volume usage statistics
- Viewing channel adapter (CHA) usage statistics
- Viewing channel processor (CHP) usage statistics
- Viewing disk adapter (DKA) usage statistics
- Viewing disk processor (DKP) usage statistics
- Viewing data recovery and reconstruction processor (DRR) usage statistics
- Viewing write pending rates
- Viewing access path usage statistics
- Workload and traffic statistics
- Index
40 Auto LUN/Performance Control Base Monitor for the XP128/XP1024
If a remote copy initiator issues I/Os to an RCU target, the disk subsystem on the RCU target side does not
count the I/Os. Therefore, information about the I/Os will not be displayed in the LDEV or Port-LUN tab on
the RCU target side.
Usage statistics
Collecting usage statistics about disk array resources
To obtain usage statistics about a disk array’s resources, complete the following instructions to start
monitoring the disk array.
1. In the Auto LUN pane, click Monitoring Options. The Monitoring Options pane appears.
2. Under Long range monitoring S/W and/or Short range monitoring S/W, click ON for the Current
Status option.
3. Use the two lists in Gathering Time to specify the time when the disk array collects statistics.
4. Click Apply. Auto LUN starts monitoring the disk array.
To stop monitoring the disk array, complete the following instructions. If you stop monitoring, Auto LUN
stops collecting statistics.
1. In the Auto LUN pane, click Monitoring Options. The Monitoring Options pane appears.
2. Under Long range monitoring S/W, click OFF for the Current Status option.
3. Click Apply.
Viewing parity group usage statistics
Auto LUN monitors parity groups, and displays average and maximum usage rates for the specified
period. Auto LUN also displays a graph illustrating changes in parity group usage within that period.
1. In the Auto LUN pane, click Physical, and click the Parity Group folder. The table displays usage
statistics about the parity group.
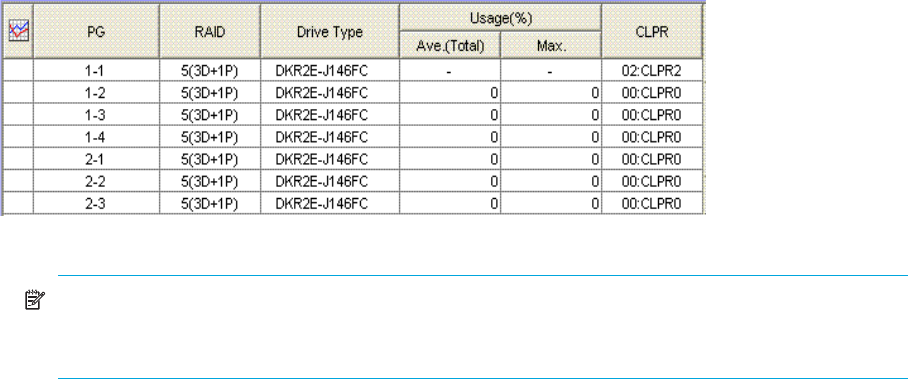
Figure 14 Parity group usage statistics
NOTE: If an exclamation mark (!) appears before a usage rate, that parity group usage rate might
be inaccurate because the configuration has changed (for example, volumes have been moved by
a migration plan or changed by VSC).
2. To display a graph illustrating changes in usage rates, click the parity groups in the table, and click
Draw.
The table displays the following items:
• Graph column: The check mark icon indicates the graph is currently illustrating data for that item.
• PG: Parity group ID.
• RAID: RAID level (RAID-5 or RAID-1).
• Drive Type: Hard disk drive type.
• Usage: The Ave. (Total) column displays the average usage rate in the specified period. The Max.
column displays the maximum usage rate in the specified period.
• CLPR: The number and name of the CLPR that corresponds to the parity group. For more information
about CLPRs, see the HP StorageWorks XP Disk/Cache Partition User Guide.