
HP Hitachi Universal Replicator for Mainframe User Guide (T5278-96044, November 2011)
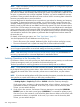

NOTE: If you specify an unmounted volume, the graph is not displayed.
IMPORTANT: When a graph displays, the LDKC number, the CU number and the LDEV
number appear above the graph. If the volume is an external volume, the pound or gate
symbol (#) appears after the LDEV number. For detailed information about external
volumes, see the HP XP24000/XP20000 External Storage Software User's Guide.
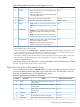
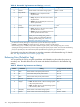
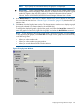
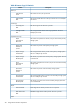
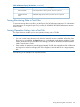
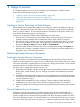
4. In the Monitor Data box, select the I/O statistics data that you want to display on the graph.
You must select at least one box. “Remote Copy I/O Statistics” (page 216) describes the I/O
statistics data.
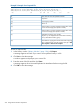
5. Click Set to close the Display Item window. The Usage Monitor window now displays a graph
showing the selected I/O statistics data for the selected LU(s).
To enlarge the displayed graph, right-click the graph, and select the Large Size command. To
return the graph to normal size, right-click the graph, and select the Normal Size command.
NOTE: To stop displaying the usage monitor graph, right-click the graph, and select Close.
To stop displaying all graphs, select Close All. The usage monitor graph closes automatically
in the following cases:
• When you select another tab
• When you select another program product
• When you exit the Remote Web Console software
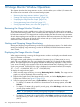
Figure 87 Display Item Window
Displaying the Usage Monitor Graph 215