
Hitachi TrueCopy for IBM z/OS User and Reference Guide (T5211-96001, June 2007)

Performing TrueCopy for z/OS Configuration Operations 5-43
Hitachi Universal Storage Platform V TrueCopy for IBM z/OS User’s Guide
Displaying the Usage Monitor Graph
When usage monitoring is running, the Usage Monitor window can display
user-selected remote copy I/O statistics in real time.
The usage monitor graph plots the user-selected I/O statistics (up to 65 data
points) on an x-y graph. The x-axis displays time. The y-axis displays the
number of I/Os during the last sampling period. The legend (right side of the
graph) indicates the data being displayed. A value on the y-axis varies
according to the maximum value of the statistical data that is displaying. If the
value on the y-axis exceeds 10,000,000, the value is displayed in exponential
notation (e.g., 1E7 = 1×10
7
= 10,000,000; 2E8 = 2×10
8
= 200,000,000). The
Update field displays the most recent data sample time for the data on the
graph.
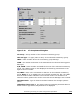
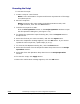
To display the usage monitor graph:
1. Make sure that usage monitoring is running (Monitoring Switch = Enable).
The usage monitor graph can only be displayed when monitoring is on.
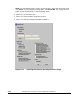
2. Right-click the graph area of the Usage Monitor window, and click Display
Item to open the Display Item dialog box (see Figure 5-11).
3. If you want to display I/O statistics for all volumes to be monitored in the
storage system, click All Volumes. If you want to display I/O statistics for a
specific volume, click Volume, and then enter the LDKC number (00 or 01),
CU number (00-3F) and LDEV ID (00-FF) of the desired volume.
Note: If you specify unmounted volume, the graph is not displayed.
Note: LDKC number:CU number:LDEV number is displayed on the top of
the graph. If "#" is added to the end of LDEV number like 00:00:3F#, the
LDEV that the LDEV number indicates is an external volume. For details on
an external volume, please refer to the Universal Volume Manager User's
Guide.
If you want to display I/O statistics for the sidefile data, click CLPR, and
then select the desired CLPR from the drop-down list.
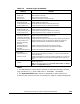
4. In the Monitor Data box, select the I/O statistics data that you want to
display on the graph. You must select at least one box. Table 5-4 describes
the I/O statistics data.
Note: If you want to display Average Transfer Rate, Pair Synchronized, or
SideFile, you cannot select any other statistics at the same time. The graph
can only display one type of data at a time: I/O count, rate, or percent.
5. Click Set to close the Display Item dialog box. The Usage Monitor window
now displays a graph showing the selected I/O statistics data for the selected
LDEV(s).
To enlarge the displayed graph, right-click the graph, and click the Large
Size command. To return the graph to normal size, right-click the graph,
and click the Normal Size command.