
Open Source Object Storage for Unstructured Data: Ceph on HP ProLiant SL4540 Gen8 Servers
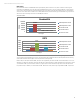
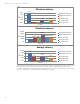
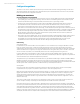


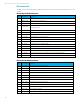
Table Of Contents
- Executive summary
- Introduction
- Overview
- Solution components
- Workload testing
- Configuration guidance
- Bill of materials
- Summary
- Appendix A: Sample Reference Ceph Configuration File
- Appendix B: Sample Reference Pool Configuration
- Appendix C: Syntactical Conventions for command samples
- Appendix D: Server Preparation
- Appendix E: Cluster Installation
- Naming Conventions
- Ceph Deploy Setup
- Ceph Node Setup
- Create a Cluster
- Add Object Gateways
- Apache/FastCGI W/100-Continue
- Configure Apache/FastCGI
- Enable SSL
- Install Ceph Object Gateway
- Add gateway configuration to Ceph
- Redeploy Ceph Configuration
- Create Data Directory
- Create Gateway Configuration
- Enable the Configuration
- Add Ceph Object Gateway Script
- Generate Keyring and Key for the Gateway
- Restart Services and Start the Gateway
- Create a Gateway User
- Appendix F: Newer Ceph Features
- Appendix G: Helpful Commands
- Appendix H: Workload Tool Detail
- Glossary
- For more information
Reference Architecture | Product, solution, or service
Block testing
HP presents less data around RBD traffic than object IO partly because there’s more public content around tuning and
performance for RBD. One reason for that is because RBD testing is easier to set up. No object gateway or object storage
access code is required and block storage benchmarking tools are easy to get and well understood. It’s recommended to
search for some of this other content for more detail; Mark Nelson‘s performance blog posts at Inktank are good places to
start as are Ceph community comments around RBD performance.
Bandwidth & IOPS
The results show a fair amount of bandwidth on sequential IO tests; the sequential read test is getting over 800 MB/sec with
a queue depth of 8. Sequential writes perform at a bit less than half of that; this matches with expectations from the way
replica traffic behaves and the lighter load in an optimal case (4M object IO).
Random IO pure read peaks at 8755 IOPS, with pure write significantly less at about 24% of that total (2084)—more of an
efficiency drop than just replication overhead. The MIX load is again interesting, a 70% read/30% write split results in a total
ops level that’s 70% of pure read. Most of this drop is again ‘pull’ from the load incurred by writes to the read part of the
test; read IO drops to 49% of pure read instead of 70%. On the other hand, writes only dropped IOPS to 88% of pure write.
401932
830066
70048
23885
34352
14718
0
200000
400000
600000
800000
1000000
Test Type
KB/sec
Bandwidth
256K sequential writes
256K sequential reads
8K random reads
8K random writes
8K mix test reads
1569
3240
8755
2084
4292
1838
0
2000
4000
6000
8000
10000
Test Type
IOPS
256K sequential writes
256K sequential reads
8K random reads
8K random writes
8K mix test reads
23