
Open Source Object Storage for Unstructured Data: Ceph on HP ProLiant SL4540 Gen8 Servers
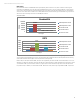
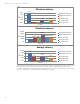


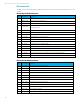
Table Of Contents
- Executive summary
- Introduction
- Overview
- Solution components
- Workload testing
- Configuration guidance
- Bill of materials
- Summary
- Appendix A: Sample Reference Ceph Configuration File
- Appendix B: Sample Reference Pool Configuration
- Appendix C: Syntactical Conventions for command samples
- Appendix D: Server Preparation
- Appendix E: Cluster Installation
- Naming Conventions
- Ceph Deploy Setup
- Ceph Node Setup
- Create a Cluster
- Add Object Gateways
- Apache/FastCGI W/100-Continue
- Configure Apache/FastCGI
- Enable SSL
- Install Ceph Object Gateway
- Add gateway configuration to Ceph
- Redeploy Ceph Configuration
- Create Data Directory
- Create Gateway Configuration
- Enable the Configuration
- Add Ceph Object Gateway Script
- Generate Keyring and Key for the Gateway
- Restart Services and Start the Gateway
- Create a Gateway User
- Appendix F: Newer Ceph Features
- Appendix G: Helpful Commands
- Appendix H: Workload Tool Detail
- Glossary
- For more information
Reference Architecture| Ceph on HP ProLiant SL4540 Gen8 Servers
CPU%
The results show the selected CPU doesn’t go much above 50% even at peak, so there’s plenty of CPU headroom.
GET traffic:
• The object gateway shows average CPU usage highest for small objects, ramping down to fairly minimal around 1M.
Small objects are constrained by IOPS processing here. Peak CPU at the object gateway is much higher from 64K to 512K,
settling down again in the larger object size ranges.
• On the OSD Host, the average CPU follows the same curve as the object gateway but proportionally less so since the IOs
through three object gateways are distributed across the ten nodes of the Ceph cluster. OSD Host peak CPU is
interestingly different; past the 512K mark the increased impact of IO missing file system cache is visible.
PUT traffic:
• Utilization curve on the object gateway is reversed from GETs (most CPU is at largest object sizes) and never reaches as
high. Some of this is from the object gateway issuing the original IO and waiting for the primary OSD(s) to complete the
object replication. The higher bandwidth and multiple ‘slices’ for processing larger objects keeps the gateway busier.
• On the OSD Host, PUTs always go to disk and there’s a proportionally larger amount of IO from replication. So there’s
higher load, and large objects can saturate drives depending on cluster object distribution. Note the valley around 512K
with maximal block IO efficiency; 64K is also an improved CPU efficiency point versus very small objects.
MIX traffic:
• On the object gateway, average CPU roughly tracks the lowest common denominator between GETs and PUTs (although
there’s a noticeable spike on the 16K object size). At peak, the load matches closer to GET—the dominating portion of the
90/10 MIX. There are 2 points where the MIX test peak is significantly closer to the PUT line: 128k and 4M.
• OSD average CPU shows a very similar tracking to GET IO with a 16K spike. At peak, the impact of processing PUTs keeps
the MIX load around or above what’s measured for 100% GET traffic.
0
20
40
60
1K
16K
64K
128K
512k
1M
4M
16M
128M
% CPU
Object Size
Object GW, Avg CPU
PUT
GET
MIX
0
20
40
60
1K
16K
64K
128K
512k
1M
4M
16M
128M
% CPU
Object Size
Object GW, Peak CPU
PUT
GET
MIX
0
10
20
30
1K
16K
64K
128K
512k
1M
4M
16M
128M
% CPU
Object Size
OSD Host, Avg CPU
PUT
GET
MIX
0
20
40
60
1K
16K
64K
128K
512k
1M
4M
16M
128M
% CPU
Object Size
OSD Host, Peak CPU
PUT
GET
MIX
22