
Open Source Object Storage for Unstructured Data: Ceph on HP ProLiant SL4540 Gen8 Servers
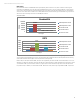
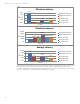


Table Of Contents
- Executive summary
- Introduction
- Overview
- Solution components
- Workload testing
- Configuration guidance
- Bill of materials
- Summary
- Appendix A: Sample Reference Ceph Configuration File
- Appendix B: Sample Reference Pool Configuration
- Appendix C: Syntactical Conventions for command samples
- Appendix D: Server Preparation
- Appendix E: Cluster Installation
- Naming Conventions
- Ceph Deploy Setup
- Ceph Node Setup
- Create a Cluster
- Add Object Gateways
- Apache/FastCGI W/100-Continue
- Configure Apache/FastCGI
- Enable SSL
- Install Ceph Object Gateway
- Add gateway configuration to Ceph
- Redeploy Ceph Configuration
- Create Data Directory
- Create Gateway Configuration
- Enable the Configuration
- Add Ceph Object Gateway Script
- Generate Keyring and Key for the Gateway
- Restart Services and Start the Gateway
- Create a Gateway User
- Appendix F: Newer Ceph Features
- Appendix G: Helpful Commands
- Appendix H: Workload Tool Detail
- Glossary
- For more information
Reference Architecture | Product, solution, or service
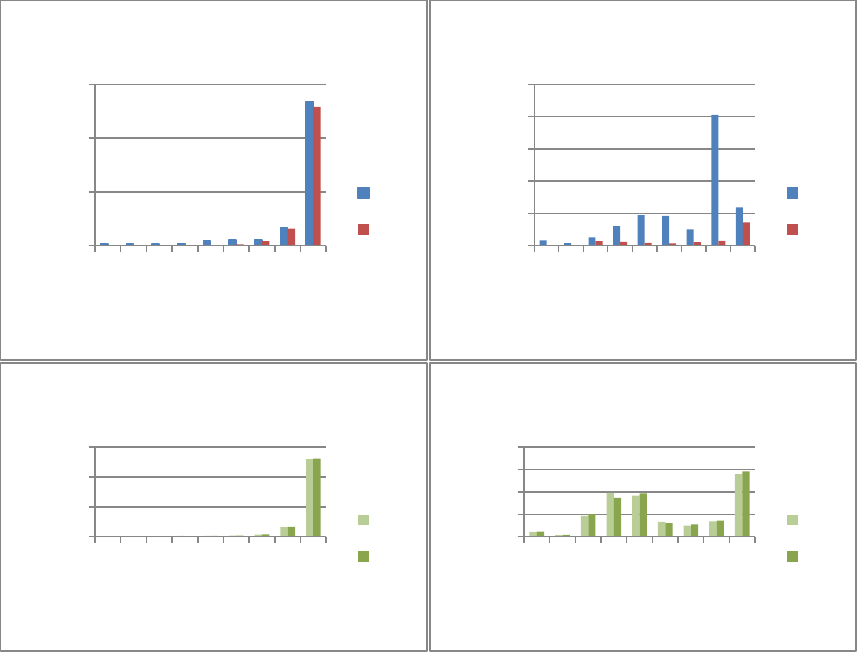
Latency
Object storage latencies are higher than typical SAN storage. Some of that is expected with the architecture (HTTP server,
networking), but those factors don’t cover all performance impacts. Minimum latency data for object IO is less interesting—
it’s still relatively long compared to block—so those graphs are not presented.
• Average PUT latencies are in the 100s of milliseconds, with a significant uptick around 512K versus smaller object sizes.
One-to-many Swift IOs that result in a number of RADOS objects being written (16M, 128M) are less latent than: 4M IO
latency * ( object size/4M).
• Average GET latencies are generally faster than PUT, which agrees with bandwidth and IOPs results above. Only the 128M
sample doesn’t show much difference between PUT and GET latency.
• Maximum latency for GETs is not much worse than average latency, and is sub 20 seconds across the board. Maximum
PUT latency is greater for all but the 128M case. The very large spike at 16M appears to be an aberration as compared
with average latency, but it’s important to note that max latency for object PUTs can be in the 10s of seconds.
• The MIX test is a more complicated picture. The PUT and GET average latencies show almost identical tracking to each
other, and are similar to the 100% GET/PUT test passes. Max latencies form an S curve, where the range between 64K
and 1M spike. The ‘pull’ effect of PUTs show here with similar maximum latencies for GETs and PUTs, and those
maximum latencies are greater than 100% GET but significantly less than 100% PUT.
0
5
10
15
1k
16k
64k
128k
512k
1m
4m
16m
128m
Seconds
Object Size
PUT/GET Avg Latency
PUT
GET
0
20
40
60
80
100
1k
16k
64k
128k
512k
1m
4m
16m
128m
Seconds
Object Size
PUT/GET Max Latency
PUT
GET
0
5
10
15
1k
16k
64k
128k
512k
1m
4m
16m
128m
Seconds
Object Size
MIX Avg Latency
PUT
GET
0
5
10
15
20
1k
16k
64k
128k
512k
1m
4m
16m
128m
Seconds
Object Size
MIX Max Latency
PUT
GET
21