
ProLiant BL e-Class C-GbE Interconnect Switch Web-based Interface Reference Guide

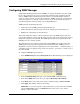

Configuring the Switch Modules using the Web-based Interface
Monitoring Switch Module Functions
The Web-based monitoring screens allow you to monitor the following switch module
functions:
•
•
•
•
•
•
•
•
•
•
•
•
•
•
•
Port Utilization
Packets—Received (RX), UMB-cast (RX), Transmitted (TX)
Errors—Received (RX) and Transmitted (TX)
Size—Packet Size
Trunk Utilization
MAC Address Table
IGMP Snooping Table
Dynamic Group Registration
VLAN Status Table
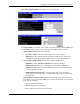
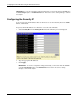
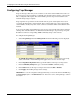
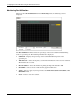
Monitoring the Switch Module using the Active Switch Graphic
At the top of the main page, an active graphic of the switch module displays.
You can monitor the switch module status using the following:
Graphical LEDs display current link speed and activity.
RJ-45 connectors labeled 1 through 20 represent NIC 1 (on Switch A) or NIC 2 (on
Switch B) of server bays 1 through 20.
RJ-45 connectors labeled 21 and 22 on Switch A and Switch B represent cross-connect
ports.
RJ-45 connector labeled 23 on Switch A represents the port connected to the Integrated
Administrator.
RJ-45 connector labeled Mgmt represents the Integrated Administrator Management
connector (Switch A port 24 – 10/100 Ethernet).
RJ-45 connectors labeled UpLink1 and UpLink2 represent Gigabit Ethernet Port 25 and
Port 26 of the switch module.
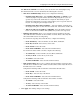
IMPORTANT:
• RJ-45 connectors that are grayed out on the graphic of the current switch module belong to the
other switch module.
• Pointing on an RJ-45 connector that belongs to this switch module displays the port number.
• Selecting an RJ-45 connector that belongs to this switch module displays the port statistics.
HP ProLiant BL e-Class C-GbE Interconnect Switch Web-based Interface Reference Guide 2-45