
9.2 HP Pay per use Utility Meter II Software Installation and Configuration Guide (December 2010)
•
Communication fails between the OA and the Utility Meter
. The traffic between the OA and the Utility
Meter runs over port 443 (HTTPS). This port needs to be open on a firewall that is between the OA
and the Utility Meter.
•
Communication fails between the Utility Meter and HP
. The usage-data transport method (HTTPS or
email) to HP may have failed. Ask the network specialist if the networks, proxy servers, and/or firewalls
were inadvertently altered causing usage data to stop. If the data transport method is set to HTTPS,
ensure that port 443 on the customer’s firewall is open for traffic between the IP address of the Utility
Meter and 15.216.12.81 and 15.217.53.98, which are the IP addresses of the host receiving the
Usage Reports. For information on testing the connection for HTTPS or email, see Section 3.3: “Verifying
Connectivity”.
•
The PPU backend systems at HP are down or they are not accepting the usage data
. The HP PPU Web
application receiving the usage data may have a problem. This problem should be temporary and HP
personnel are probably working on resolving this problem.
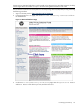
4.2 General Troubleshooting Information
• Utility Meter Log Files
The Utility Meter log files are located in the following folder:
/var/opt/hp/remotesupport/umeter/log. The main log file is uc.log and will list any failures,
errors, warnings, etc.
A list of log files can also be seen on the Troubleshoot tab in the Utility Meter GUI.
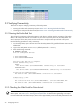
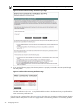
• umadmin status Command
The umadmin status command displays the status of the ucd daemon process so that you can verify
the Utility Meter is running.
Or view the status of the ucd daemon process on the Troubleshoot tab in the Utility Meter GUI.
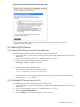
• umadmin list Command
The umadmin list command lists the devices being monitored by the Utility Meter, their collection
status, and their submission status.
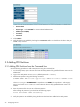
Or view a list of configured devices on the Device Management tab in the Utility Meter GUI. Note
that a status showing a green circle means the device is okay, and a red square means there is a
problem with the device.
• Configuration Files
The following configuration files are located in the /etc/opt/hp/RemoteSupport/umeter/config/
folder:
• uc_config.xml – contains information about devices being monitored by the Utility Meter
• uc_properties.xml – contains information that should never be modified
• uc_properties_delta.xml – contains properties that can be modified
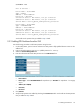
• Enabling Debug Mode
Debug mode will add additional information to the log files to aid in troubleshooting. To enable debug
mode, open the /etc/opt/hp/RemoteSupport/umeter/config/uc_properties_delta.xml
file and locate the following line:
<property name="logfileThreshold" value="INFO"/>
Change the value attribute from INFO to DEBUG:
<property name="logfileThreshold" value="DEBUG"/>
Or enable debug mode in the Logfile Threshold Value Adjustment section on the Troubleshoot
tab in the Utility Meter GUI.
30 Troubleshooting the Utility Meter