
HP OneView Deployment and Management Guide 1.10

Technical white paper | HP OneView Deployment and Management Guide
112
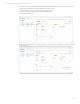
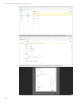
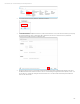
5. Selecting the Utilization panel heading or selecting Utilization from the view menu allows display and navigation of all
available history of a specified metric.
OR
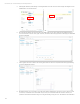
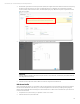
6. Once selected, the details pane will show the first available metric for the device expanded. By default the last 24
hours of information is shown on the graph. However, the date bar below the graph allows selecting any available date
range to be displayed
.
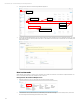
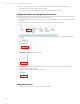
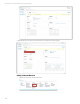
7. Custom graphs can also be created. This custom graph allows two metrics to be plotted on the same graph allowing
comparison between the metrics.
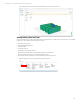
8. HP OneView allows you to view areas in your data center that are insufficiently cooled due to various reasons such as
poor airflow, concentration of excessive heat output, or wrap-around airflow at the ends of aisles. Likewise, it is
possible to determine areas that are being overcooling and wasting cooling resources. HP OneView’s 3D visualization