HP OneView for VMware vCenter Operations Manager User Guide Abstract This guide provides the information you need to install and use HP OneView for VMware vCenter Operations Manager to monitor performance for servers, and is intended for administrators who monitor and direct system performance, capacity, and configuration information for HP OneView managed servers and infrastructure.
© Copyright 2014 Hewlett-Packard Development Company, L.P. Confidential computer software. Valid license from HP required for possession, use or copying. Consistent with FAR 12.211 and 12.212, Commercial Computer Software, Computer Software Documentation, and Technical Data for Commercial Items are licensed to the U.S. Government under vendor's standard commercial license. The information contained herein is subject to change without notice.
Contents 1 Introduction...............................................................................................4 2 Installation.................................................................................................5 Installing the software................................................................................................................5 Licensing............................................................................................................................
1 Introduction HP OneView for VMware vCenter Operations Manager provides integrated and highly automated performance, capacity, configuration compliance, and cost management tools to the vCenter Operations Manager custom GUI. The software uses the vCOPS analytics engine that analyzes what is normal and then applies those norms to a dynamic server environment. For information on vCenter Operations Manager, see VMware vCenter Operations Manager Enterprise documentation at http://www.vmware.
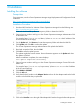
2 Installation Installing the software Prerequisites For prerequisites, see the vCenter Operations Manager vApp Deployment and Configuration Guide located at: http://www.vmware.com/support/pubs/vcops-pubs.html Installation Procedure 1. Download HP OneView for VMware vCenter Operations Manager from the following site: http://www.hp.com/go/ovvcenter Extract the downloaded zip file to a temporary folder to obtain the PAK file. 2.
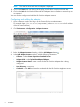
NOTE: This must be done each time an adapter is deployed. 12. Click on the Status tab, near the top of the page, to take focus away from the Info tab. 13. Click on the Info tab and check the Describe and Adapter Version numbers to ensure they are as expected. You now need to configure and add the HP OneView Adapter instance. Configuring and adding the adapter 1. Open a browser window and log in to the Custom GUI as an administrator.
5. 6. Click Test to make sure the parameters are correct. Click OK. The HP OneView Adapter instance appears in the Adapter Instances list. Licensing HP OneView for VMware vCenter Operations Manager is licensed with HP OneView. You need an HP OneView license for each host you will be monitoring with this integration and VMware vCenter Operations Manager. VMware vCenter Operations Manager must also be acquired for each of the hosts as per VMware licensing guidelines.
6. 7. Click on the Status tab, near the top of the page, to take focus away from the Info tab. Click on the Info tab and check the Describe and Adapter Version numbers to ensure they are as expected. Troubleshooting the software installation Known troubleshooting information can help you diagnose and correct problems with the HPOneviewVCopsAdapter_#.log files which contain valuable information about adapter instance operation.
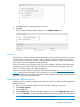
The hpOneViewAdapter3 resources appear in the List tab in the Data Source column and is indicated by the icon. Figure 1 HP OneView Adapter Kind Adapter Instances The adapter instance for the HP OneView instance is hpOneViewAdapter3 Instance. Use 1. 2. 3. the following procedure to view the adapter instance: In vCenter Operations Manager, click ENVIRONMENT→ENVIRONMENT OVERVIEW. Expand the Adapter Instances in the list. Expand the hpOneViewAdapter3 instance.
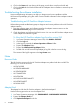
Figure 2 HP OneView instance 10 Installation
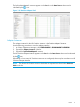
Metrics reported for all resources The metrics that are reported by the resources are shown in Table 1 (page 11).
• Full Set—Active KPI Breach Count • Full Set—KPI Count • Full Set —Metric Count • Full Set—New Anomaly Count • Full Set—New KPI Breach Count • Self—Active Anomaly Count • Self—Active KPI Breach Count • Self—Change Index • Self—Health Score • Self—KPI Count • Self—Metric Count • Self—New Anomaly Count • Self—New KPI Breach Count • Self—Total Anomalies Installation
3 Dashboards The customized HP dashboard is available as a tab or from the DASHBOARDS menu in the vCenter Operations Manager custom GUI. The standard HP OneView Dashboard has two widgets—Custom Relationships as well as Health Tree and Metrics. Standard dashboards cannot be customized; however, you can clone them and then customize them using the additional standard widgets. To modify the dashboard, see “Editing a dashboard” (page 13).
• HP SERVER HARDWARE • HP SERVER PROFILE • HP CONNECTION • HP NETWORK • HP LOGICAL INTERCONNECT • HP INTERCONNECT • HP UPLINK PORT The following figure displays a typical HP OneView Dashboard with a highlighted Enclosure and its objects: To initialize the interactions of the dashboard, you must first select a host. The health status for the host and related servers and enclosures will be updated and displayed in the HEALTH TREE widget.
- Health badge. The health badge selects the badges in the storage system that represent health values for the resources in the storage system. The health badges indicate the current storage system performance. - Good state. The health of the resource is normal. - Abnormal state. The resource is experiencing some level of problem. - Degraded state. The resource may have some serious problem. - Bad state. The resource is either not functioning properly or will fail soon. - Unknown state.
HEALTH widget This widget shows a graphical representation of the health of the selected object. An icon is shown for each resource of the object and a colored box indicates the health status for each resource (see “Dashboard color coding” (page 13)). Double clicking an icon will bring that resource into focus and display a detailed health graphic in the HEALTH STATUS widget. To return to a previous view, click the Reset to Initial Resource button at the top of the widget.
HP widget icons Some of the resources in the HP OneView Dashboard are represented by HP OneView icons. The following is a list of the icons and their association with the resources. - Server Hardware - Server profile - Virtual Connect interconnect HEALTH STATUS widget This widget shows a detailed representation of the health of the selected resource over time. The resources are selected by clicking an icon in the HEALTH widget. The timeline and other parameters can be changed using the Widget button .
- Stacked graph. - Y axis. - Metric graph. - Trend line. - Dynamic thresholds. - Show dynamic period entire thresholds. - Anomalies. - Show data point tips. - Zoom by x. - Zoom by y. - Zoom to fit. - Zoom to dynamic thresholds. - Compress graphs. - Zoom all graphs. Y axis values will not turn to scientific form to maintain the same axis width across all graphs. - Pan. - Show data values. - Auto refresh. - Date controls. - Generate dashboard. - Remove all.
ALERTS This widget shows a lists of all alerts for all monitored resources in the storage system. The list can be sorted by column heading. 1. Select an entity. 2. Click Show alerts icon which is a small, red icon. A list of all alerts related to enclosure is displayed. • Sub-Type—shows the sub type of the alert. • Resource Name—the name of the resource. • Resource Kind—the type of resource. • Start Time—the time the alert first appeared. • Duration—how long the alert has persisted.
- Resets interaction. - Perform a multi-source interaction. - Colorize rows by alert type. - Cancel alert. - Suspend. - Suppress. - Take ownership. - Release ownership. MAPPING DETAILS widget This widget shows a health tree for the server hardware resource in the widget. The selected resource appears in the center of the graphic of the widget and related resources (treated as parents and children) are shown above and below the resource.
- Show the resource detail. - Show alerts. - Display filter criteria.
4 Support and other resources This chapter describes the support available for HP OneView for VMware vCenter Operations Manager. Related topics • “Information to collect before contacting HP” (page 22). • “How to contact HP” (page 22). • “Registering for software technical support and update service” (page 22). • “HP authorized resellers” (page 23). • Related information.
You can access this portal from the HP Support Center: http://www.hp.com/go/hpsc After creating your profile and linking your support agreements to your profile, see the Software Updates and Licensing portal at http://www.hp.com/go/hpsoftwareupdatesupport to obtain software, documentation, and license updates. HP authorized resellers For the name of the nearest HP authorized reseller, see the following sources: • In the United States, see the HP U.S. service locator website at http://www.hp.
Glossary vApp A collection of virtual machines.
Index A Adapter Instance, 9 Adapter Kind, 8 D dashboard cloning, 13, 14 color codes, 13 customizing, 13 editing, 13 document related information, 23 H HP OneView for VMware vCenter Operations Manage configuration, 6 HP OneView for VMware vCenter Operations Manager licensing, 7 software location, 5 troubleshooting installation, 8 version, 7 M metrics reported for HP 3PAR resources, 11 R related documentation, 23 Resource Kinds, 8 25