
HP Network Protector SDN Application Administrator Guide
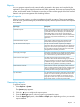
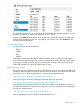
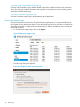

5. Optional. Select a graph type.
6. Click the Time Range to set the duration for which you want to view the reports.
7. Click the Time Interval to set the frequency at which you want to generate the reports.
8. Click the Render report to generate the report.
9. Scroll down or click configure - icon at the top to view the generated report.
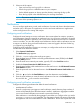
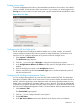
Alerts
Alerts give notification of internal events that affect the application operation, and in some cases
indicate that some action is needed to correct a condition. Alerts also indicate any policy breach
or malicious DNS requests from end hosts. The Alerts generated by the administrator, user, or an
event are visible in the Alerts display.
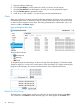
Figure 25 Example of Alerts View
The three alert levels are:
• Informational
• Warning
• Critical
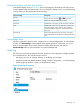
To navigate through the alert listings, use the arrow keys of the alert display. To select the number
of alerts to display in a single view, use the options of the alert display. (For listings exceeding the
length of the alert display, you can also use the scroll bar on the right side of the view.)
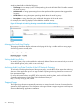
Refresh the Alert Listing
The alert page is a static display and the new alerts do not automatically appear in the Alerts
view. When you click Refresh to refresh the alert page, new alerts appear on the Alerts view.
52 Monitoring