
HP Network Protector SDN Application Administrator Guide

8 Monitoring
HP Network Protector panels
The application console provides configurable panels that enable you to view, monitor, and analyze
health, status, and events at system and switch levels. These panels provide a high-level warning
system for potential health and performance problems with your system and devices. The system
status tool monitor characteristics of system health and report on the basic health and status of the
network. The main focal points of the health and status panels include:
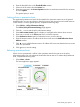
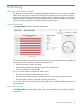
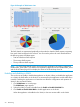
System status panel
Select System Status to display the system health status.
The system status panel monitors the system health characteristics and reports the basic health and
status of the network. It provides a graphical representation of:
• The top hosts making malicious requests
• All the blocked requests originating from the various VLAN groups
• Summary of real-time in-coming traffic
You can view the summary of the network traffic such as:
• The maximum number of DNS requests per second
• The total number of DNS requests originating from the network during the past 24 hours
• The total number of malicious requests during the past 24 hours
You can also view the list of all the end hosts along with their IP and MAC addresses quarantined
by the application.
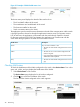
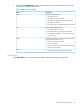
Device status panel
Select Device Status to display details of the switch and the health status of the VLAN configured
on the switch.
HP Network Protector panels 47