
HP Network Optimizer SDN Application - Microsoft Lync 1.0 Administrator Guide
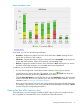
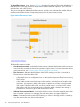
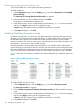
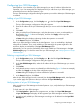

Figure 8 QoE Metrics chart
In the chart, you can view the following information:
• Green bar—Displays the number of sessions whose QoE state is Good, meaning the Lync
session did not have any QoE violations.
• Yellow bar—Displays the number of session whose QoE state is Acceptable, meaning the Lync
session had QoE violations, but the QoE remained in the tolerable range.
• Red bar—Displays the number of session whose QoE state is Bad, meaning the Lync session
had QoE violation that resulted in user-noticeable performance degradation.
In addition, you can perform the following operations:
• You can click the legend of a QoE state to hide the statistics of Lync sessions with the
corresponding QoE state in the chart. For example, if you click in the chart, the
green bar for presenting the statistic of Good sessions is hidden.
• Click the View QoE Metrics link under the chart to enter the QoE Metrics page, which provides
a filter function that allows you to customize your view of the QoE Metrics statistics. For more
information, see “Viewing Lync QoE Metrics statistics.”
• Hover your pointing device over a bar and a tooltip appears showing the related information.
For example, if you move the cursor on a green bar, the tooltip displays the number of Good
sessions during the corresponding time period.
Viewing the Best effort reasons chart
If Net Optimizer - Lync fails to apply a predefined DSCP value to a flow in the edge switch, the
flow is regarded as a Best effort flow and is classified by its Best effort reasons.
Viewing the Best effort reasons chart 21