
HP Network Optimizer SDN Application - Microsoft Lync 1.0 Administrator Guide
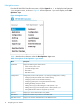
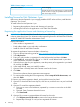
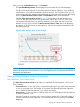
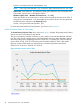
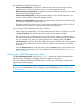
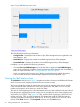

Figure 7 Lync SDN Manager status chart
The chart displays the following information:
• Configured bar—Displays the total number of Lync SDN Managers that are registered in the
Net Optimizer - Lync.
• Reachable bar—Displays the number of reachable registered Lync SDN Managers.
• Unreachable bar—Displays the number of unreachable registered Lync SDN Managers.
In addition, you can perform the following operations:
• Click the View Lync SDN Managers link under the chart to display the Lync SDN Managers
page, which provides the IP address of each registered Lync SDN Manager and its reachability
state. For more information, see “Viewing added Lync SDN Managers.”
• Hover your pointing device over a bar to display a tooltip that shows related information,
such as number of the Lync SDN Managers registered in the Net Optimizer - Lync.
Viewing the QoE Metrics chart
The QoE Metrics chart, shown in Figure 8, displays the number of sessions with different QoE states
which occurred in each sampling interval for the most recent two days.
The y-axis indicates the number of sessions that occurred in the sampling time interval, and the
x-axis indicates the data collection time. Each color represents a QoE status. You can view the
number and proportion of the sessions in each QoE status.
The value of each sampling point is calculated based on the Lync data collected in the time interval
from the previous sampling point to the current one. For example, the value of the sampling point
at 2014–03–05 19:29:25 in the Figure 8 is 7234, and the values of green bar, yellow bar, and
red bar are 5034, 1700, and 500 respectively. This means that a total of 7234 Lync sessions
occurred during the time interval from 2014–03–05 13:29:25 to 2014–03–05 19:29:25, which
include 5034 Good sessions, 1700 Acceptable sessions, and 500 Bad sessions.
20 Viewing Net Optimizer - Lync dashboard