
HP Network Optimizer SDN Application - Microsoft Lync 1.0 Administrator Guide
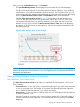
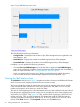

The chart displays the following information:
• Active sessions (Blue line)—Displays the number of active sessions that occurred in each
sampling interval. When a Lync session starts, it is in Active status until it ends.
• Max concurrent users (Green line)—Displays the maximum number of concurrent users in active
sessions during each sampling interval.
• Licensed users (Orange line)—Displays the total number of users with Net Optimizer - Lync
licenses in active sessions during each sampling interval.
• Grace users + 20% (Red line)—Displays the maximum number of granted users allowed in the
active sessions during each sampling interval.
When the number of concurrent users in active sessions exceeds the license limit of 120% of
licensed users, Net Optimizer - Lync stops performing QoS deployment.
You can change what is displayed on the chart as follows:
• Click the legend corresponding to a line to hide the line in the chart. For example, if you click
in the chart, the blue line for active session statistic is hidden.
• Move the cursor over a sampling point of a line in the chart to display a tooltip that shows
the corresponding statistics over the time range from the previous sampling point to the specified
one. For example, if you hover your pointing device over a sampling point of the Max
concurrent users line (Green), the tooltip displays the maximum number of the concurrent users
during the period and the date and time when the number of concurrent users reached the
peak value.
• Click the View Sessions link under the chart to enter the Sessions page, which provides more
details about the active sessions. For more information about viewing sessions, see “Viewing
the Lync sessions.”
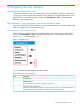
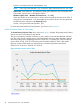
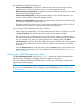
Viewing Lync SDN Manager status chart
The Lync SDN Manager Status chart, shown in Figure 7, displays the number of registered Lync
SDN Managers with different reachability states in the latest two day period.
The y-axis indicates the different reachability states, and the x-axis indicates the number of the
registered Lync SDN Managers.
NOTE: Lync SDN Managers must be registered with the Net Optimizer - Lync to appear in this
chart. For more information about how to register a Lync SDN Manager, see “Configuring Lync
SDN Managers.”
Viewing Lync SDN Manager status chart 19