
HP Network Optimizer SDN Application - Microsoft Lync 1.0 Administrator Guide

5 Viewing Net Optimizer - Lync dashboard
Net Optimizer - Lync dashboard provides an intuitive way to understand the Lync call statistics in
your network, including Lync sessions, servers, QoS configuration status, and related metrics. In
addition, the dashboard provides a basis for troubleshooting Lync QoS problems and further
optimizing the Lync service.
The dashboard contains charts that illustrate various metrics related to Lync calls along with a
corresponding link below each chart that provides additional details.
• Active sessions/users in time
• Lync SDN Manager status
• QoE Metrics
• Best effort reasons
Accessing Net Optimizer - Lync dashboard
You can access the Dashboard page through one of the following methods:
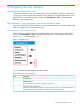
• Navigation menu
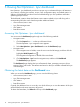
1. Click the Expand icon on the top of the main frame.
The Net Optimizer - Lync navigation menu appears.
2. Select Net Optimizer - Lync→Dashboard to enter the Dashboard page.
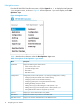
• Navigation tree
1. If the navigation tree is hidden, move the cursor over the left margin, and then click the
highlighted Hide/Expand icon .
The navigation tree appears on the left of the main frame.
2. Click Net Optimizer - Lync from the navigation tree, and then click Dashboard.
The Dashboard page appears.
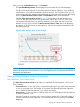
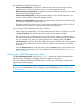
The Dashboard page displays the Lync call statistical charts, presenting overviews of Lync
sessions, flows, and servers. The statistics are based on the Lync call data collected from Lync
SDN Managers.
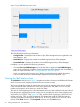
Obtaining the latest data on the Dashboard view
When you access the Dashboard page, you can view the following charts:
• Active sessions/users in time
• Lync SDN Manager status
• QoE Metrics
• Best effort reasons
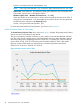
Currently, the dashboard view is a two-day view which allows you to view the statistics of the Lync
call data that from the most recent two day period.
To obtain the latest data, click Refresh on the top of the Dashboard page.
16 Viewing Net Optimizer - Lync dashboard