
Neoview Workload Management Services Guide (R2.5)
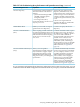

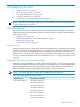
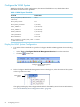

Table 3-2 Criteria for Defining Query Workloads
Related WMS SettingsDescriptionQuery Workload Characteristic
Connection rule attributes that
determine the associated WMS service:
• Session name
• Application name
• Login role (not the user name)
• Data source name for the connection
The types of users and applications,
and the queries that they issue. For
example:
• Load
• Extract
• Administrative
• Ad hoc
• Reports
• Analytics using third-party tools,
such as MicroStrategy or Business
Objects
Types of queries
Active time that is set for the WMS
service
Time of day when the queries will runTime of day
Two priority settings for queries:
• WMS service priority, which
determines when the queries in the
waiting queue of a service are
launched into execution relative to
queries in other services
• Process priority, which is set for each
of the queries' runtime processes
Priority of the workload:
• How critical are the queries?
• Who is running the queries, and
how urgently do they need the
queries to complete?
Priority
Threshold values that are set for the
WMS service:
• Maximum CPU busy
• Maximum memory usage
• Maximum rows fetched
Resource consumption by the queries:
• Do the queries access a single row?
• Do the queries process small,
medium, or large numbers of rows?
• Are the queries tuned and
optimized?
Resource consumption
Analyzing and Refining the Query Workload Configuration
After you have set up the WMS services and rules for the query workloads, you can use various
Neoview management tools to monitor and analyze the performance of the queries and the
system resource usage:
Table 3-3 Tools for Monitoring Query Performance and System Resource Usage
Actions That You Can TakeCapabilitiesNeoview Management Tool
Use this information to establish
compilation and execution rules.
Provides real-time monitoring of
queries in WMS. You can look at a
query's runtime metrics and compare
the actual costs with the estimated
costs while the query is running.
Neoview Performance Analysis
Tools:
• Live View tab in the Neoview
Performance Analyzer
• Neoview Query Viewer
Use this information to establish WMS
service thresholds.
Provides real-time monitoring of
system resources and enables you to
detect processes and queries that use
excessive CPU resources and memory.
You can drill down to obtain detailed
information about each process and
examine the query plan, compiler and
runtime statistics, and memory usage
counters to determine the source of the
problem. For more information, see
the HPDM online help or the HP
Database Manager (HPDM) User Guide.
HP Database Manager (HPDM):
System Offender
44 Understanding Your Workload Environment