
Neoview Workload Management Services Guide (R2.5)
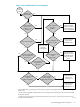
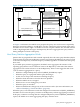

During the statistics aggregation, the configured WMS interval (WMS_INTERVAL) determines
how frequently the NDCS server updates the WMS process with the query statistics. WMS makes
those query statistics available for real-time monitoring in the Neoview Performance Analyzer
(or the Neoview Query Viewer). The configured WMS interval must be less than or equal to the
Repository interval (REPOS_INTERVAL).
At the end of query statistics aggregation, the NDCS server writes the aggregated query statistics
to the underlying base table of the QUERY_STATS_VW2 view in the NEO.HP_METRICS schema.
This view, which replaces QUERY_STATS_VW1, is where the Repository collects compilation
and runtime statistics for queries. In the QUERY_STATS_VW2 view, the QAG_OPTION column
indicates whether a record consists of aggregated statistics, and the QAG_TOTAL column shows
the total number of queries that were aggregated. For more information, see the Neoview Repository
User Guide.
How to Enable Query Statistics Aggregation
You can enable query statistics aggregation and determine the types of queries that will have
their statistics aggregated by specifying aggregation parameters in a connection rule. If you are
adding a new connection rule, see Step 7 in “Add a Connection Rule” (page 74) or the “ADD
RULE CONN Command” (page 178). If you are altering an existing connection rule, see the
Aggregate group box in “Set the Connection Rule Attributes” (page 78) or the “ALTER RULE
CONN Command” (page 192).
How to Start Using WMS
To configure WMS and monitor query workloads, you can use either of these management tools:
• The graphical user interface (GUI) of the Neoview Performance Analysis Tools (NPA Tools)
• WMS commands in the Neoview Command Interface (NCI)
Here are some steps and cross-references to help get you started:
For more information ...Task
See Chapter 2: Getting Started.Install the necessary management tools, NPA Tools or
NCI, and assign WMS administrators.
1.
See Chapter 3: Understanding Your Workload
Environment.
Identify and define the query workloads.2.
See Chapter 4: Configuring Services.Configure WMS services and thresholds to identify and
separate queries into manageable workloads.
3.
See Chapter 5: Configuring Rules.Configure connection, compilation, and execution rules,
and associate the rules with the WMS services.
The connection rules assign a query to a WMS service.
The compilation and execution rules automatically take
actions on queries that are not meeting performance
requirements.
4.
See Chapter 6: Monitoring and Managing Workloads.Monitor the system resources, services, and queries in
real time, and take appropriate actions to prevent rogue
queries from monopolizing system resources.
5.
See “Analyzing and Refining the Query Workload
Configuration” (page 44).
Analyze real-time and historical metrics, and make
improvements where needed to the WMS configuration.
Repeat steps 3 to 5.
6.
For an overview of how to use WMS, see an “Example of How to Use WMS” (page 31).
30 Introduction