
Neoview Workload Management Services Guide (R2.5)
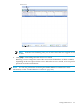
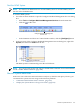
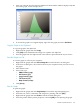


3. After you select the area, the Neoview Platform Counter Details window displays only that
area of the graph, as this example shows:
4. To restore the graph to its original display, right-click the graph, and select Un-Zoom.
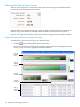
Copy the Graph to the Clipboard
To copy the graph to the clipboard:
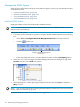
1. Right-click the graph, and select Copy.
2. Click [OK] when notified that the image was copied to the clipboard.
3. Paste the graph from the clipboard into a document or presentation file of your choice.
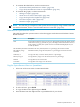
Save the Graph to a File
To save the graph to a file on your computer:
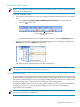
1. Right-click the graph, and select Save Image As to launch the Save As dialog box.
2. In the Save As dialog box, choose the location on your computer when you want to store
the graph.
3. Enter the file name.
4. Select a file type:
• PNG Format (*.png)
• Gif Format (*.gif)
• Jpeg Format (*.jpg)
• Tiff Format (*.tif)
• Bmp Format (*.bmp)
5. Click [Save].
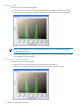
Print the Graph
To print the graph:
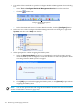
1. Right-click the graph, and select Page Setup to launch the Page Setup dialog box.
2. Select the size, source, orientation, and margins for printing, and click [OK].
3. Right-click the graph, and select Print to launch the Print dialog box.
4. Select the printer and the printer properties, and click [OK] to start printing the graph.
Monitor System Resources 169