
Neoview Workload Management Services Guide (R2.5)
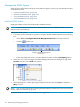
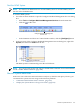


2. To examine the tabular data, see these instructions:
• “Understand the System Resource Values” (page 167)
• “Copy the System Resource Data to a Spreadsheet” (page 167)
3. To examine the graphs, see these instructions:
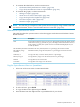
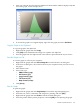
• “Enlarge a Graph” (page 168)
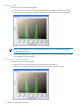
• “Zoom In on an Area of the Graph” (page 168)
• “Copy the Graph to the Clipboard” (page 169)
• “Save the Graph to a File” (page 169)
• “Print the Graph” (page 169)
NOTE: You can also get a snapshot of the system resource usage by using a WMS command.
For more information, see the “STATUS WMS DETAIL Command” (page 255).
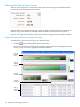
Understand the System Resource Values
This table describes the system resource values that appear in the Neoview Platform Counter
Details window:
DescriptionField
Date and time when the system resources are checked and reported. The display format
of the date is mm/dd/yyyy (month, day, year). The display format of the time is hh:mm:ss
(hour, minutes, seconds). The system resources are checked and displayed every 30
seconds by default.
Time
Maximum CPU busy allowed (shown as a percentage). Zero means no limit.Max Node Busy Threshold
Maximum memory usage allowed (shown as a percentage). Zero means no limit.Max Memory Usage
Threshold
Average CPU busy across the cluster (shown as a percentage)Node Busy %
Average memory usage across the cluster (shown as a percentage)Memory Usage %
Average disk I/O across the clusterDisk IOs
Average disk cache usage across the clusterCache Hits
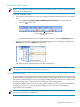
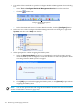
Copy the System Resource Data to a Spreadsheet
1. Select one of the rows in the Counter Details table.
2. To select all rows, press Ctrl-A.
3. To copy the data to the clipboard, press Ctrl-C.
4. Paste the data from the clipboard into a spreadsheet file of your choice.
Monitor System Resources 167