
Neoview Workload Management Services Guide (R2.5)


Understand the Platform Status Counters
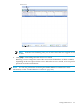
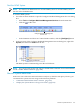
The Live View displays the current state of the system resource usage in the Platform Status
Counters box near the bottom of the window:
The Platform Status Counters box displays the percentage of node (CPU) busy, percentage of
memory usage, total number of disk I/Os, and total number of cache hits in the system.
The Live View updates this display of the system resource usage every 30 seconds by default.
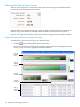
Display the System Resource Usage Over Time
To display the system resource usage over a period of time:
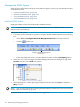
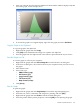
1. Click the icon in the Platform Status Counters box.
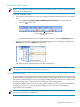
The Neoview Platform Counter Details window appears and starts displaying the system
resource usage over time in graphical and tabular formats:
Average
Memory
Usage %
Average
Disk IOs
Average
Node
Busy %
Data in
Tabular
Format
Average
Cache Hits
166 Monitoring and Managing Workloads