
Neoview Workload Management Services Guide (R2.5)

Display the Services Status
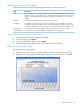
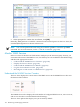
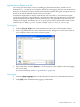
To display the state of the services:
1. Click the icon in the NWMS Services box.
The Statement and Services Counter Details window appears and displays a summary and
detailed information about the WMS services:
Services
Status
The NWMS Services Summary box displays data from the NWMS Services box in the Live
View and includes the CPU Busy and Memory Usage percentages from the last sample. This
data is refreshed every 30 seconds by default.
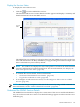
NOTE: The window also displays the state of the queries over time in the Total Statement
Counters and Statement Counters Details boxes. For more information, see “Display the
State of the Queries Over Time” (page 140).
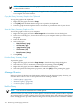
2. To examine the services details, see these instructions:
• “Understand the NWMS Services Details” (page 147)
• “Log the Service Details to a File” (page 149)
3. To reconfigure or take action on a service, see “Reconfigure or Take Action on a WMS
Service” (page 150).
NOTE: You can also get a snapshot of the state of the services by using a WMS command. For
more information, see the “STATUS SERVICE Command” (page 245).
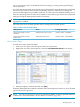
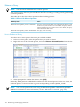
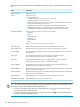
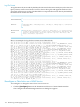
Understand the NWMS Services Details
The NWMS Services Details box displays the current state of the services and their definitions.
Any service that exceeds one or more of its threshold settings appears in red text and its row is
shaded in gray.
Monitor WMS Services 147