
Neoview Workload Management Services Guide (R2.5)
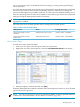
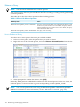

Understand the Statement Counters Details
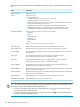
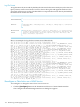
This table describes the fields that appear in the Statement Counters Details box:
DescriptionField
Date and time when the statement counters are checked and reported. The display format of
the date is mm/dd/yyyy (month, day, year). The display format of the time is hh:mm:ss (hour,
minutes, seconds). The statement counters are checked and displayed every 30 seconds by
default.
Time
Total number of queries in the executing state at a given timeRunning
Total number of completed queries at a given time. The Live View includes queries in the
Completed count only if the queries have completed within the last minute (or 60 seconds).
One minute after finishing execution, a query is no longer included in the Completed count.
Completed
Total number of queries in the waiting state or that returned an error at a given timeWaiting/Error
Total number of queries in the holding or suspended state at a given timeSuspended/Hold
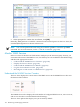
Copy the Query Summary Data to a Spreadsheet
1. Select one of the rows in the Counter Details table.
2. To select all rows, press Ctrl-A.
3. To copy the data to the clipboard, press Ctrl-C.
4. Paste the data from the clipboard into a spreadsheet file of your choice.
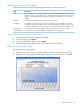
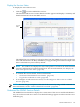
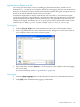
Enlarge the Query Summary Graph
To increase the size of the graph:
1. Place the cursor at a corner of the graph until the cursor becomes a double arrow ( ).
2. Drag the corner of the graph until the graph expands to the desired size. For example:
Monitor Queries 141