
Neoview Workload Management Services Guide (R2.5)

Display the State of the Queries Over Time
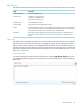
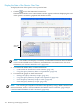
To display the state of the queries over a period of time:
1. Click the icon in the Statement Counters box.
The Statement and Services Counter Details window appears and starts displaying the state
of the queries over time in graphical and tabular formats:
State of the
Queries
NOTE: The window also displays a summary and detailed information about the WMS
services in the NWMS Services Summary and NWMS Services Details boxes. For more
information, see “Monitor WMS Services” (page 146).
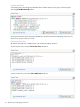
2. To examine the tabular data, see these instructions:
• “Understand the Statement Counters Details” (page 141)
• “Copy the Query Summary Data to a Spreadsheet” (page 141)
3. To examine the graph, see these instructions:
• “Enlarge the Query Summary Graph” (page 141)
• “Copy the Query Summary Graph to the Clipboard” (page 142)
• “Save the Query Summary Graph to a File” (page 142)
• “Print the Query Summary Graph” (page 142)
NOTE: You can also get a snapshot of the state of the queries by using a WMS command. For
more information, see the “STATUS SERVICE SEGMENT STATS Command” (page 250) (or
“STATUS WMS SEGMENT STATS Command” (page 256)).
140 Monitoring and Managing Workloads