
Neoview Workload Management Services Guide (R2.5)
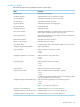

DescriptionName
Total space used by the executor in the disk processEid Space Used
Total heap allocation by the executor in the disk processEid Heap Alloc
Total heap used by the executor in the disk processEid Heap Used
Total memory allocated for the query, which is the sum of the SQL Space Used
and SQL Heap Used
Total Memory Allocated
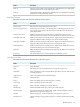
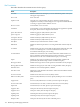
Per-Table Statistics
This table describes the per-table statistics for the query:
DescriptionField
Name of the tableTABLE NAME
Estimated total number of rows that will be accessed by all the scan, insert,
update, and delete operators in the query plan
EST ACCESSED ROWS
Estimated total number of rows that will be accessed by scan and insert operators
in the query plan
EST USED ROWS
Actual number of rows accessedACCESSED ROWS
Actual number of rows returned after the predicates were applied. In a pushed
down plan, all the used rows might not be returned.
USED ROWS
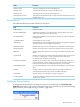
Number of messages sent to execute operations on the tables used by the queryMESSAGE COUNT
Number of messages bytes sent while accessing the tables used by the queryMESSAGE BYTES
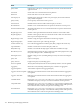
Number of disk-read operations for accessing all the tables referenced by the
query
DISK IOS
Number of lock waits. This counter indicates the number of times the query had
to wait on a conflicting lock. A value of 0 indicates that no locks were
encountered while the query was executing.
LOCK WAITS
Number of lock escalations. This counter indicates the number of times row
locks escalated into a file lock during the execution of the query. A value of 0
indicates that no locks were escalated while the query was executing.
LOCK ESCALATIONS
Processor (CPU) utilization, in seconds, spent by the disk process to execute the
query
PROCESS BUSYTIME
Number of opens (one per partition), which is the number of OPEN calls
performed by the Neoview SQL executor on behalf of the query
OPENS
Amount of time, in seconds, spent on opens for the queryOPEN TIME
An internal counter indicating the last time (internal form) when the per-table
statistics were updated.
LAST UPDATED
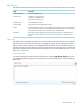
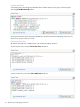
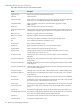
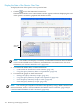
Display the Session Statistics
To display the session statistics for the query that you are monitoring, click View Session
Statistics in the upper right corner of the Monitoring Query window. (To open the Monitoring
Query window, see “Display the Query Details” (page 127).)
Monitor Queries 137